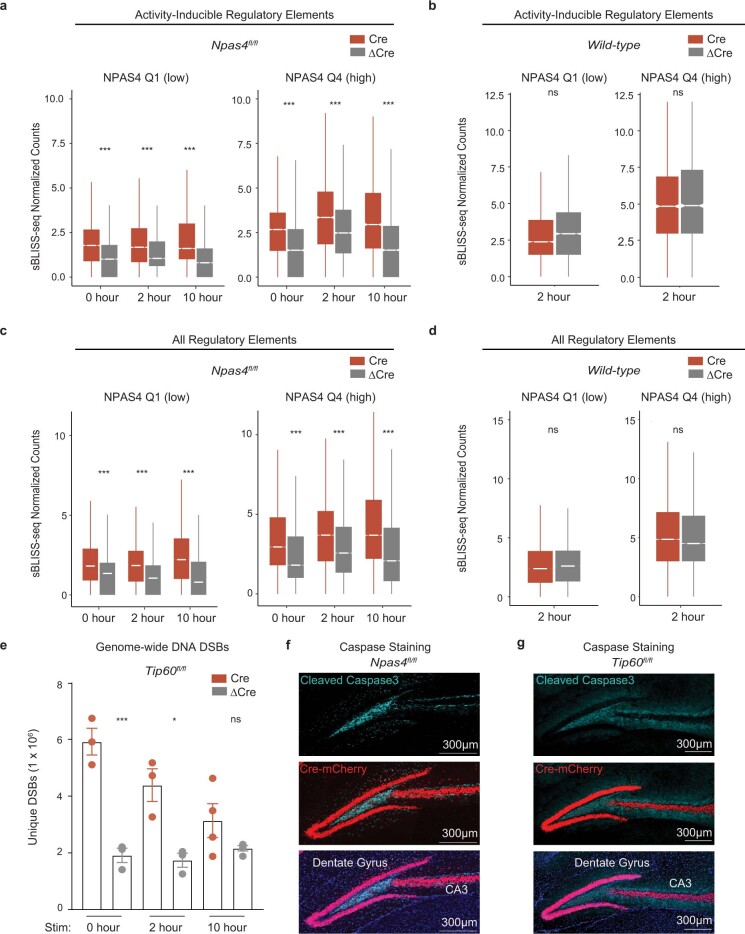
Extended Data Fig. 12. Loss of NPAS4-NuA4 increases DNA breaks across the neuronal genome.
a. Boxplots of sBLISS-seq normalized counts in nuclei isolated from Npas4fl/fl mice injected with Cre-mCherry (Npas4-cKO) or ΔCre-GFP virus (Control) at activity-inducible regulatory elements, subset by quartiles of NPAS4 CUT&RUN signal (see Methods, Extended Data Fig. 7a). Q1 = 1,017 sites, Q4 = 764 sites. Data plotted includes all datapoints coming from 5 replicates per genotype; no averaging across replicates was performed. Boxplot shows median (line), IQR (box), 1.5x IQR (whiskers), notches indicate median ± 1.58× IQR/sqrt(n). ***P < 2.2e-16 P values by unpaired, one-tailed Wilcoxon rank-sum tests (Cre > ΔCre). b. Boxplots of sBLISS-seq normalized counts in nuclei isolated from wild-type mice injected with Cre-mCherry or ΔCre-GFP virus at activity-inducible regulatory elements, subset by quartiles of NPAS4 CUT&RUN signal. Q1 = 1,017 sites, Q4 = 764 sites. Data plotted includes all datapoints coming from 3 replicates per genotype; no averaging across replicates was performed. Boxplot shows median (line), IQR (box), 1.5x IQR (whiskers), notches indicate median ± 1.58× IQR/sqrt(n). Q1: P = 1; Q4 P = 0.995. P values by unpaired, one-tailed Wilcoxon rank-sum tests (Cre > ΔCre). c. Boxplots of sBLISS-seq normalized counts in nuclei isolated from Npas4fl/fl mice injected with Cre-mCherry (Npas4-cKO) or ΔCre-GFP virus (Control) at all regulatory elements, subset by quartiles of NPAS4 CUT&RUN signal (see Methods for regulatory site definition). Q1 = 44,864 sites, Q4 = 7,378 sites. Data plotted includes all datapoints coming from 5 replicates per genotype. Boxes represent the interquartile range with line at the median. Boxplot shows median (line), IQR (box), 1.5x IQR (whiskers), notches indicate median ± 1.58× IQR/sqrt(n). ***P<2.2e-16. P values by unpaired, one-tailed Wilcoxon rank-sum tests (Cre > ΔCre). d. Boxplots of sBLISS-seq DeSeq2 normalized counts in nuclei isolated from wild-type injected with Cre-mCherry or ΔCre-GFP virus at all regulatory elements, subset by quartiles of NPAS4 CUT&RUN signal (see Methods for regulatory site definition). Data plotted includes all datapoints coming from 3 replicates per genotype. Boxplot shows median (line), IQR (box), 1.5x IQR (whiskers), notches indicate median ± 1.58× IQR/sqrt(n). Q1: P = 1; Q4 P = 0.1092. P values by unpaired, one-tailed Wilcoxon rank-sum tests (Cre > ΔCre). e. Average ± s.e.m. of genome-wide breaks in hippocampal nuclei isolated from Tip60fl/fl mice (0 and 2 h; n = 3, 10 h; n = 4) infected with Cre or ΔCre virus. To compare across samples, input reads were downsampled to the lowest value among all conditions, and numbers of unique DNA breaks are shown. Tip60fl/fl: 0 h: P = 0.0017, 2 h: P = 0.013, 10 h: P = 0.158. P values by two-tailed, unpaired t-tests. f. Cleaved caspase 3 (apoptosis marker) staining in Npas4fl/fl mice injected with AAV to express Cre-mCherry. Representative image from 3 animals. Scale bar = 300 μm. g. Cleaved caspase 3 staining in Tip60fl/fl mice injected with AAV to express Cre-mCherry. Representative image from 3 animals. Scale bar = 300 μm.

