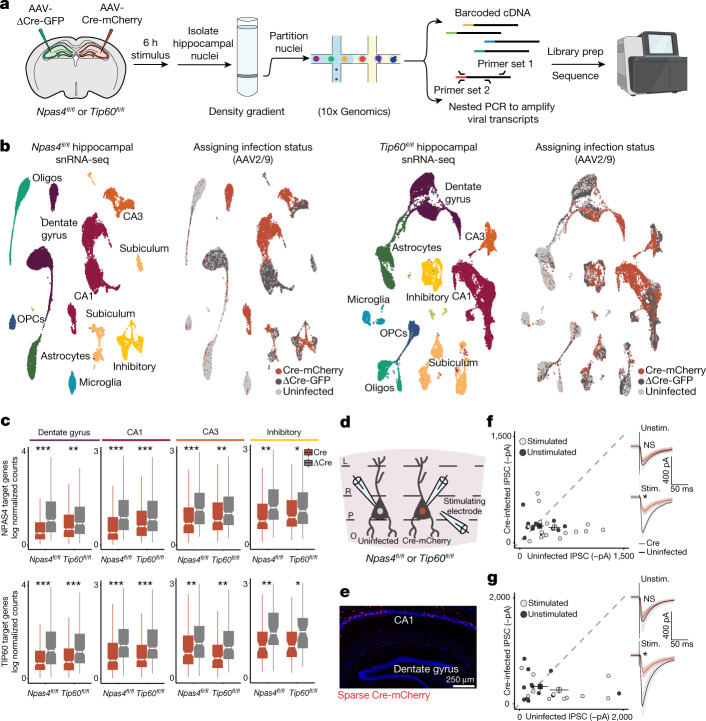
Fig. 2. NPAS4–NuA4 regulates activity-dependent transcription and recruitment of somatic inhibition.
a, Scheme of the experimental design. Nuclei were isolated from hippocampi of Npas4fl/fl and Tip60fl/fl mice expressing either Cre-mCherry or ΔCre-GFP, followed by snRNA-seq. An additional PCR step to amplify viral transcripts within the cDNA library was used to assign infection status to each nucleus. b, Left, uniform manifold approximation and projection (UMAP) visualizations of Npas4fl/fl and Tip60fl/fl snRNA-seq datasets. Right, UMAP visualizations of infection status. Npas4fl/fl: 32,418 nuclei from 2 mice, 12,963 Cre-infected, 8,845 ΔCre-infected. Tip60fl/fl: 44,511 nuclei from 3 mice, 13,536 Cre-infected, 13,461 ΔCre-infected. c, Boxplots showing the average expression (Seurat log(e) normalized counts) of NPAS4 or TIP60 target genes (Methods) comparing Cre-infected and ΔCre-infected nuclei within each neuronal celltype. Boxplots show the median (line), inter-quartile range (IQR; box) and 1.5× IQR (whiskers), and notches indicate the median ± 1.58× IQR/sqrt(n). ***P < 5 × 10⁻¹⁰, **P < 5 × 10⁻⁴, *P < 0.01. P values were calculated using unpaired, two-tailed Wilcoxon rank-sum tests. Exact P values and cell numbers per cluster provided in the source data. d, Schematic of the recording configuration, showing the stimulating electrode in the centre of the stratum pyramidale to measure IPSCs onto neighbouring Cre-infected and uninfected CA1 pyramidal neurons in either Npas4fl/fl or Tip60fl/fl acute hippocampal slices. L, lacunosum; O, oriens; P, pyramidale; R, radiatum. e, Representative image (performed in triplicate) showing sparse Cre-mCherry expression in the CA1. f,g, Scatterplots of IPSC amplitudes recorded from pairs of neighbouring uninfected and Cre-infected cells in unstimulated (Unstim.; saline) or stimulated (Stim.; low-dose KA) Npas4fl/fl (f) or Tip60fl/fl(g) mice. Points represent an uninfected–Cre-infected pair. Squares represent the average ± s.e.m. Right insets, traces of uninfected or Cre-infected cells. Npas4fl/fl: stimulated: n = 16 pairs from 4 mice; unstimulated: n = 12 pairs from 5 mice. Tip60fl/fl: stimulated: n = 11 pairs from 2 mice; unstimulated: n = 12 pairs from 2 mice. *P = 3.73 × 10⁻³ for Npas4fl/fl; *P = 0.0209 for Tip60fl/fl. Data are mean ± s.e.m. P values were calculated using unpaired, two-tailed t-tests. The sequencer image in a is from BioRender (https://biorender.com).

