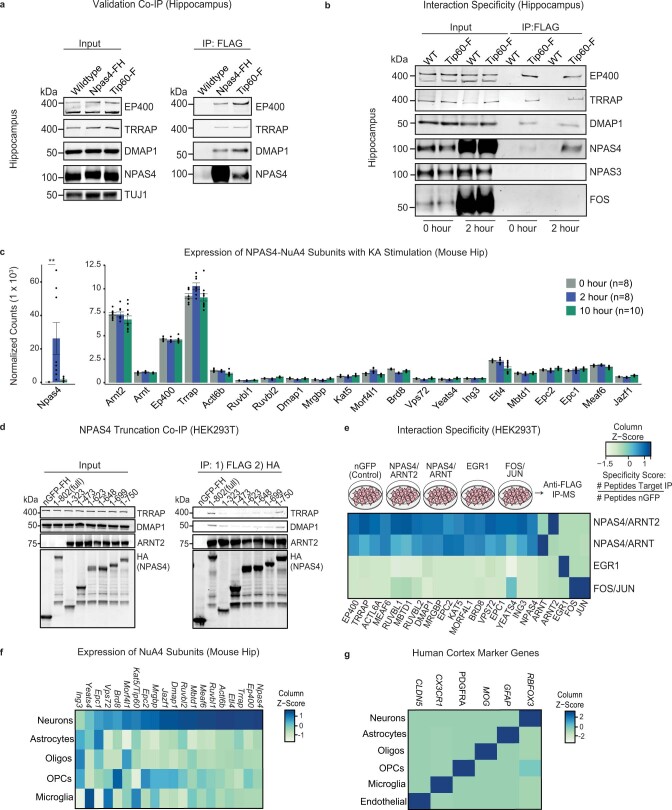
Extended Data Fig. 2. Validation of NPAS4-NuA4 interaction and neuronal specificity.
a. Confirmation that the NPAS4-NuA4 interaction can be observed via reciprocal Flag IP and Western blot from hippocampi of wild-type, Npas4-FH, and Tip60-Flag (TIP60-F) mice. Representative image from 2 experiments. See gel source data (Supplementary Fig. 1). b. Anti-Flag IP from hippocampi of Tip60-Flag (TIP60-F) mice in both unstimulated brains and 2 h post KA stimulation. Western blot demonstrates that components of the NuA4 complex interact in both the basal (0 h) and 2 h condition while NPAS4 interacts primarily in the stimulated state. Representative image from 2 experiments. See gel source data (Supplementary Fig. 1). c. Average RNA-seq DeSeq2 normalized counts ± s.e.m. of NPAS4-NuA4 components in the mouse hippocampus at 0 h (n = 8), 2 h (n = 8), and 10 h (n = 10), post KA stimulation. **P = 3.19e-29. P value determined from transcriptome-wide DeSeq2 analysis with Benjamini-Hochberg correction. See source data for individual P values. d. Full length NPAS4 (amino acids 1-802) and the indicated truncations of the C-terminal portion of NPAS4 were expressed in HEK293T cells. Sequential Flag and HA IPs were performed (right), followed by Western blotting for NPAS4, ARNT2, and NuA4 subunits TRRAP and DMAP1. Flag-HA-tagged nuclear GFP (nGFP) was included as negative control. Representative image from 3 experiments. See gel source data (Supplementary Fig. 1). e. Heatmap of the column-normalized specificity score for each component of the NuA4 complex in anti-Flag IP-MS experiments conducted with NPAS4/ARNT, NPAS4/ARNT2, FOS/JUN, or EGR1 expressed in HEK293T cells. All proteins were Flag-HA tagged. Specificity score represents the ratio of the number of peptides identified in the IP over the number of peptides found in nGFP controls performed in parallel. Replicate numbers provided in Supplementary Table 1. f. Normalized counts (Seurat v3) of NPAS4-NuA4 components from hippocampal single-nucleus RNA sequencing in mouse hippocampus, normalized across column and displayed as a Z-score. g. Marker genes identifying cell types in human primary motor cortex single-nucleus RNA sequencing dataset published by the Allen Brain Institute (see Fig. 1d)18, normalized across column and displayed as a Z-score.

