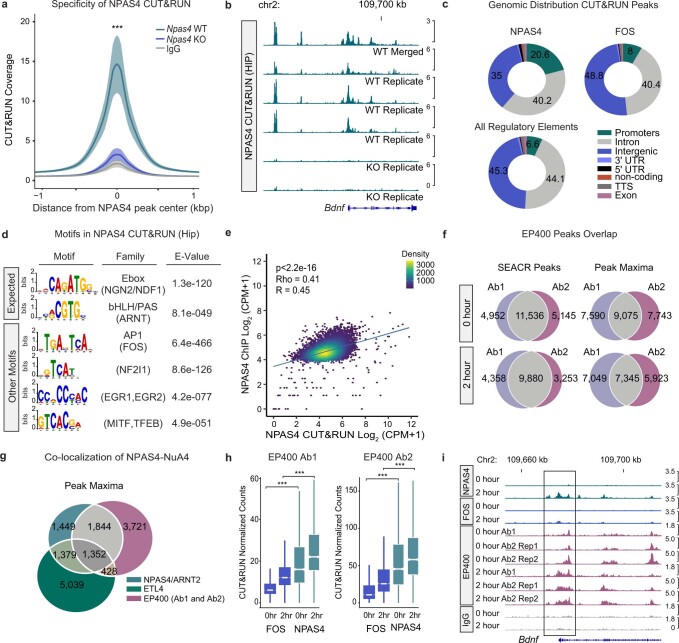
Extended Data Fig. 3. NPAS4 and NuA4 co-localize on chromatin across the genome.
a. Aggregate plot of average CUT&RUN coverage (fragment depth per bp/per peak) ± s.e.m. at NPAS4-binding sites in Npas4 wild-type vs Npas4 KO hippocampal tissue. (Npas4 wild-type: n = 5, Npas4 KO: n = 2, IgG: n = 8) 3-5 mice pooled per replicate. ***P < 2.2e-16, P values were on calculated on average signal extracted in a 2 kb window centered on NPAS4 peak summits using unpaired, two-tailed Wilcoxon rank-sum tests. b. Integrative Genomics Viewer tracks of aggregated NPAS4 CUT&RUN signal (n = 5). 3-5 mice pooled per replicate. 3 additional replicates of NPAS4 CUT&RUN signal confirm the reproducibility of NPAS4 CUT&RUN. c. Distribution of NPAS4 (10,225 sites) and FOS (11,770 sites) CUT&RUN peak annotations relative to all regulatory elements (179,841 sites) in hippocampal tissue. d. Significant motifs enriched in 10,225 NPAS4 CUT&RUN peaks. E-value calculated using MEME-ChIP72. e. Correlation between NPAS4 CUT&RUN and NPAS4 ChIP-seq reads at NPAS4 ChIP-seq peaks (10,917 ChIP-seq peaks). Values represent the log2 read depth normalized counts for CUT&RUN vs ChIP-seq. Correlation was calculated by Pearson (R = 0.45) and Spearman (Rho = 0.41) tests, P < 2.2e-16 by two-tailed correlation tests. The reciprocal analysis of the correlation between NPAS4 CUT&RUN and NPAS4 ChIP-seq reads at NPAS4 CUT&RUN peaks (10,225 CUT&RUN peaks) yields a Pearson R = 0.46 and Spearman Rho = 0.43, P < 2.2e-16 by two-tailed correlation tests. f. Venn diagram of overlaps between SEACR peaks for anti-EP400 Ab1 (antibody 1, Bethyl Labs, A300-541A) and anti-EP400 Ab2 (antibody 2, Abcam Ab5201). Peak overlaps indicate at least 1 bp overlap between the entire SEACR-enriched region. Maxima indicates overlap between regions extended 500 bp out from the peak maxima for each factor. g. Venn diagram of overlaps between SEACR peaks for NPAS4/ARNT2 co-bound peaks with ETL4 and high-confidence EP400 peaks, defined as the union of peaks shared by both EP400 antibodies. Maxima indicates overlap between regions extended 500 bp out from the peak maxima for each factor. h. Boxplot of average EP400 normalized signal (counts per million) at sites bound by FOS but not NPAS4 (labeled ‘FOS’) and sites bound by NPAS4 but not FOS (labeled ‘NPAS4’). FOS/No NPAS4 sites are defined as sites with a SEACR-determined peak of CUT&RUN signal for FOS but no peak for NPAS4 (6,998 sites) and vice versa (NPAS4/No FOS peaks: 5,550 sites). Boxplot shows median (line), IQR (box), 1.5x IQR (whiskers), notches indicate median ± 1.58× IQR/sqrt(n). 3-5 mice pooled per replicate. Replicate numbers provided in Supplementary Table 2. ***P < 2.2e-16. P values were calculated using unpaired, two-tailed Wilcoxon rank-sum tests. i. Representative Integrative Genomics Viewer tracks of replicate EP400 CUT&RUN at the Bdnf promoter.

