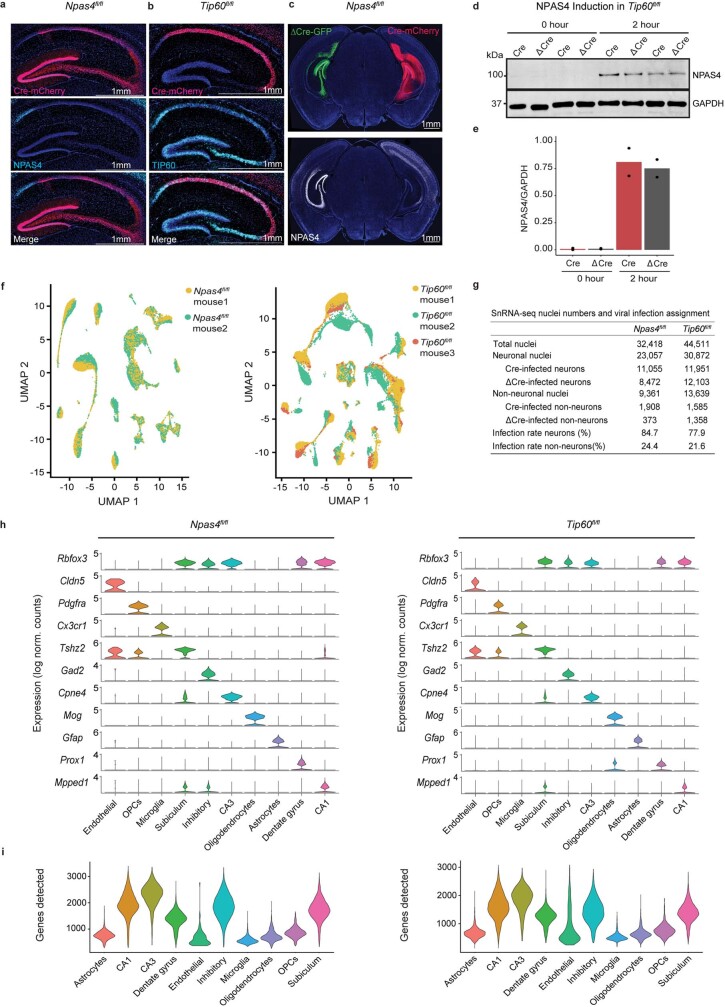
Extended Data Fig. 4. Acute deletion of NPAS4 or TIP60 by viral injection and additional quality control for single-nucleus RNA-seq datasets.
a. Immunohistochemistry image of an Npas4fl/fl mouse injected with AAV to express Cre-mCherry (shown in red) and collected 2 h post low-dose KA to induce NPAS4 (shown in cyan). Representative image from 3 animals. Scale bar = 1 mm. b. Immunohistochemistry image of a Tip60fl/fl mouse injected with AAV to express Cre-mCherry (shown in red). TIP60 (shown in cyan). Representative image from 3 animals. Scale bar = 1 mm. c. Immunohistochemistry image of both hippocampal hemispheres of an Npas4fl/fl mouse injected with Cre-mCherry and ΔCre-GFP in contralateral sides of the hippocampus and collected 2 h post low-dose KA to induce NPAS4 (shown in white). Representative image from 3 animals. Scale bar = 1 mm. d. Western blot from whole hippocampal tissue of Tip60fl/fl mice injected with AAV expressing Cre-mCherry and ΔCre-GFP in contralateral sides of the hippocampus. Tissue was collected at either 0 or 2 h post KA stimulation. Cre and ΔCre tissue was collected from each individual mouse (0 h, n = 2; 2 h, n = 2). See gel source data (Supplementary Fig. 1). e. Quantification of the Western blot is shown in d, normalizing the NPAS4 signal to loading control GAPDH. f. Left: UMAP visualization of full Npas4fl/fl snRNA-seq dataset. Nuclei are colored according to mouse of origin. 32,418 nuclei from 2 mice. Right: UMAP visualization of full Tip60fl/fl snRNA-seq dataset. Nuclei are colored according to mouse of origin. 44,511 nuclei from 3 mice. g. Summary of final nuclei numbers in Npas4fl/fl and Tip60fl/fl snRNA-seq datasets, and quantification of infection rates with Cre-mCherry and ΔCre-GFP viruses. Higher infection rate in neurons reflects the known tropism of the AAV2/9 virus used in these experiments. h. Cell-type assignment in Npas4fl/fl (left) and Tip60fl/fl (right) snRNA-seq datasets using indicated marker genes. The y-axis denotes normalized expression (Seurat loge normalized counts). i. Distribution of number of genes detected per nucleus, by cell-type. Npas4fl/fl (left) and Tip60fl/fl (right).

