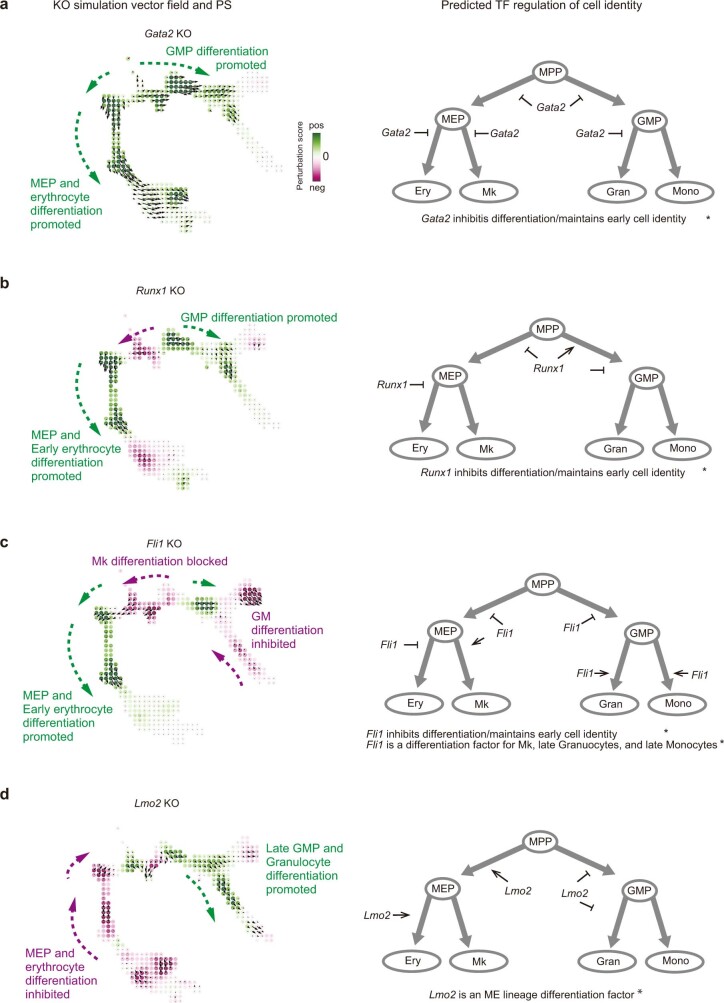
Extended Data Fig. 6. CellOracle TF KO simulation results for Paul et al. haematopoiesis data: part 2.
a–d, CellOracle KO simulation results for Gata2 (a), Runx1 (b), Fli1 (c) and Lmo2 (d). The simulated cell state transition vector field is visualized with perturbation scores (PS; magenta: negative score; green: positive score). The right column shows a summary of the TF role based on the CellOracle simulation results, cell transition vector, and PS. For example, a positive PS in the TF KO simulation (green) implies that the TF has a role in cell state maintenance or inhibiting cell differentiation. In contrast, a negative PS in the KO simulation (magenta) implies that the TF normally promotes cell differentiation.

