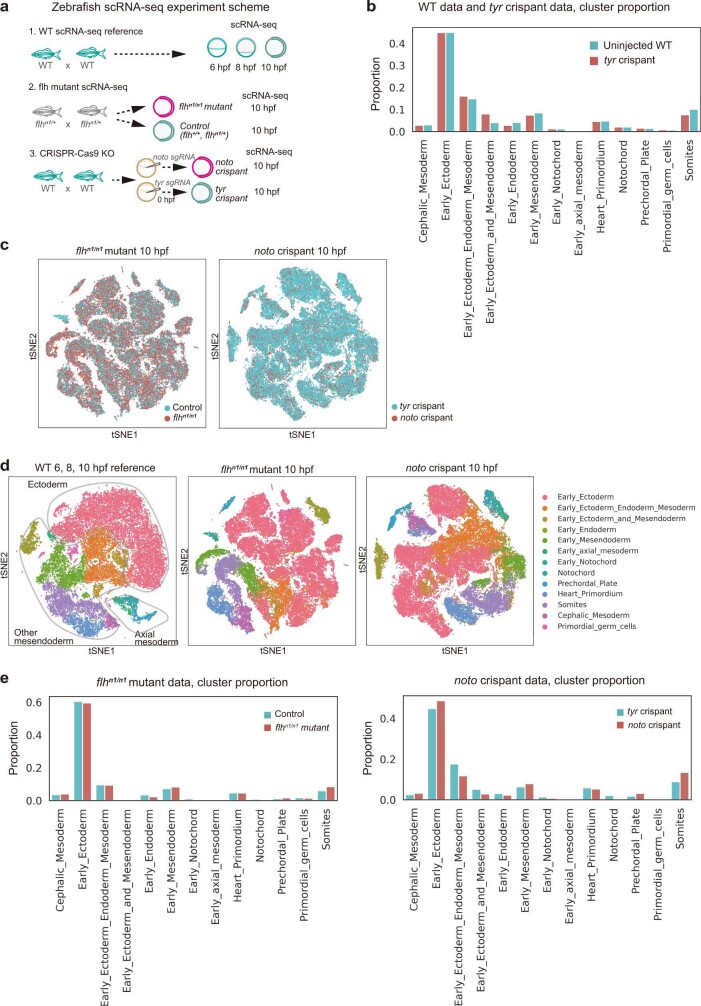
Extended Data Fig. 11. Zebrafish scRNA-seq experiments for noto LOF analysis.
(a) Schematic illustration of zebrafish scRNA-seq experiments. (1) The reference dataset was generated using cells from 6, 8, and 10 hpf wild-type (WT) embryos. To assess noto LOF, we also assayed (2) flhn1/n1 mutants and (3) noto/flh crispants at 10 hpf (~25 embryos per sample; Methods). (b) Cell cluster composition comparing tyr crispant (control) with WT cells, showing similar cell distributions. After data integration, cell-type labels were transferred from the whole WT 6, 8, and 10 hpf reference data (see Methods). (c) Sample label projected onto the t-SNE plot. flhn1/n1 mutant and control sample (left, n = 57,175 cells, 2 independent biological replicates for each sample), and t-SNE plot of noto crispant and tyr crispant samples (right, n = 9,185 cells, 2 biological, 3 technical replicates for noto crispant; n = 46,440 cells, n = 3 independent biological, 5 technical replicates for tyr crispant). (d) Cluster annotation label projected onto the t-SNE plot. WT zebrafish cells (left, n = 38,606 cells, two technical replicates per stage), flhn1/n1 mutant and control sample (middle), noto crispant and tyr crispant samples (right). (e) Cell cluster composition comparing LOF samples with the control samples.

