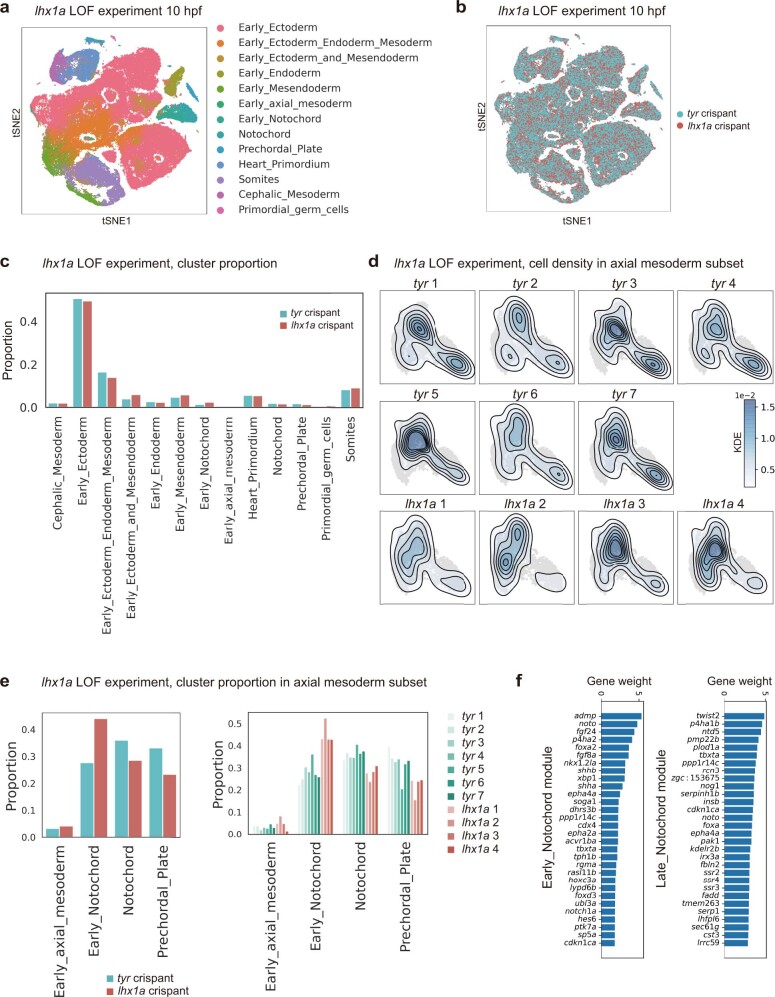
Extended Data Fig. 13. Zebrafish scRNA-seq experiments for lhx1a LOF analysis.
(a,b) t-SNE plot of lhx1a crispant (n = 45,582 cells, 4 biological replicates) and tyr control crispant samples (n = 76,163 cells, 5 biological, 7 technical replicates). (a) Cluster annotation labels transferred from WT reference data projected onto the t-SNE plot. (b) Sample label projected onto the t-SNE plot. (c) Cell cluster composition comparing lhx1a crispant and tyr control crispant samples as a proportion of cells from the whole embryo. (d) Cell density in the axial mesoderm is visualized as a kernel cell density contour plot. The cell number is downsampled to match the cell number before kernel cell density calculation (n = 260, 290, 336, and 367 for lhx1a crispant 1~4, n = 248, 234, 344, 316, 213, 286, and 350 for tyr crispant 1~7). The same contour threshold values are used for the visualization. (e) Cell cluster composition in the axial mesoderm clusters comparing lhx1a crispant and tyr control crispant samples. The left panels show cluster composition in the merged data, while the right panels show the individual scRNA-seq batch. (f) The top 30 NMF module weights for the Early notochord module (left) and the Late notochord module (right) are shown as a bar plot.

