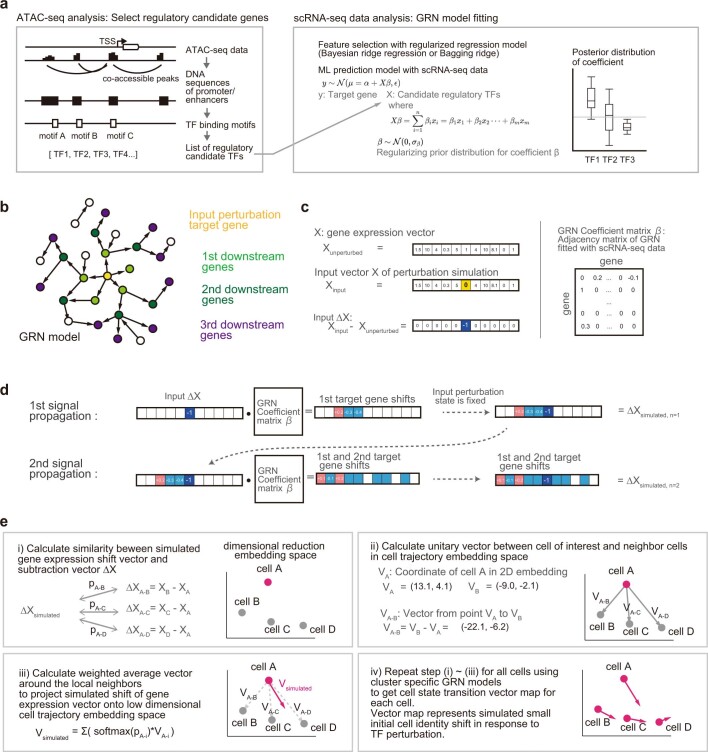
Extended Data Fig. 1. Overview of the CellOracle workflow.
(a) Overview of the CellOracle context-dependent GRN model construction method. First, genomic DNA sequence and TF-binding-motif information provide all potential regulatory links to construct a ‘base GRN.’ CellOracle uses scATAC-seq data to identify accessible promoter and enhancer DNA sequences in this step. The DNA sequence of these regulatory elements is scanned for TF-binding motifs, generating a list of potential regulatory connections between a TF and its target genes (left). Next, active connections (described below), dependent on cell state or cell type, are identified from all potential connections in the base GRN. CellOracle builds machine-learning (ML) models for this step that predict the quantitative relationship between the TF and the target gene. The ML model fitting results present the certainty of connection as a distribution, enabling the identification of GRN configurations by removing inactive connections from the base GRN structure. (b—d) Overview of signal propagation simulation. CellOracle leverages an inferred GRN model to simulate how target gene expression changes in response to the changes in regulatory gene expression. (b) The input TF perturbation (shown in yellow) is propagated side-by-side within the network model. (c) Input data and GRN coefficient matrix format used in the signal propagation calculation. (d) Leveraging the linear predictive ML algorithm features, CellOracle uses the GRN model as a function to perform the signal propagation calculation. Iterative matrix multiplication steps enable the estimation of indirect and global downstream effects resulting from the perturbation of a single TF. (e) After signal propagation, the simulated gene expression shift vector is converted into a 2D vector and projected onto the low-dimensional space. Details are described in the Methods.

