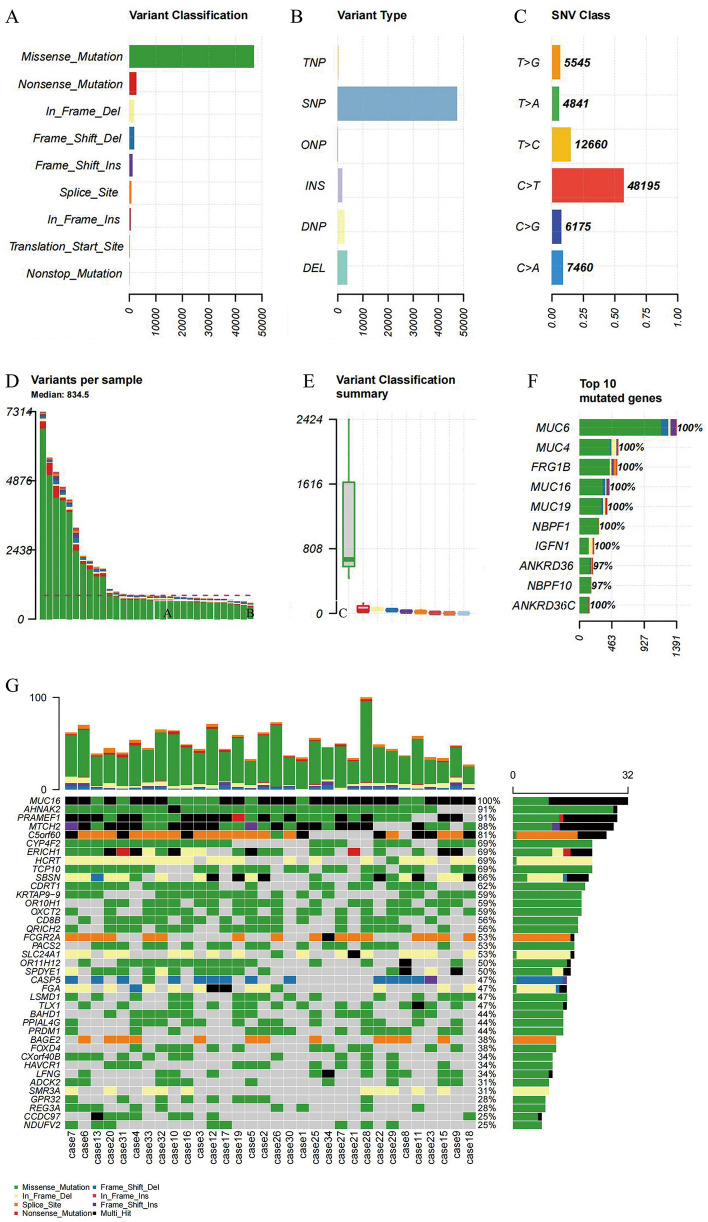
Figure 1.
Somatic mutation analysis. (A) Variant classification, x represents quantity, y represents classification (B) Variant types, x represents quantity, y represents type (C) SNV classification, x represents ratio, y represents class (D) number of variants in each sample (E) Box plot of variant types, x represents quantity, y represents classification (F) quantity and frequency of the top10 mutated genes (G) Map of high-frequency variant genes. top: quantity of variant types in each sample, x represents sample, y represents the number of variants; bottom: types of genetic variants in different samples, x represents a sample, y represents a gene’s name; right: frequency of genetic variants in different samples. x represents frequency of each gene in a sample, and y represents gene’s name.

