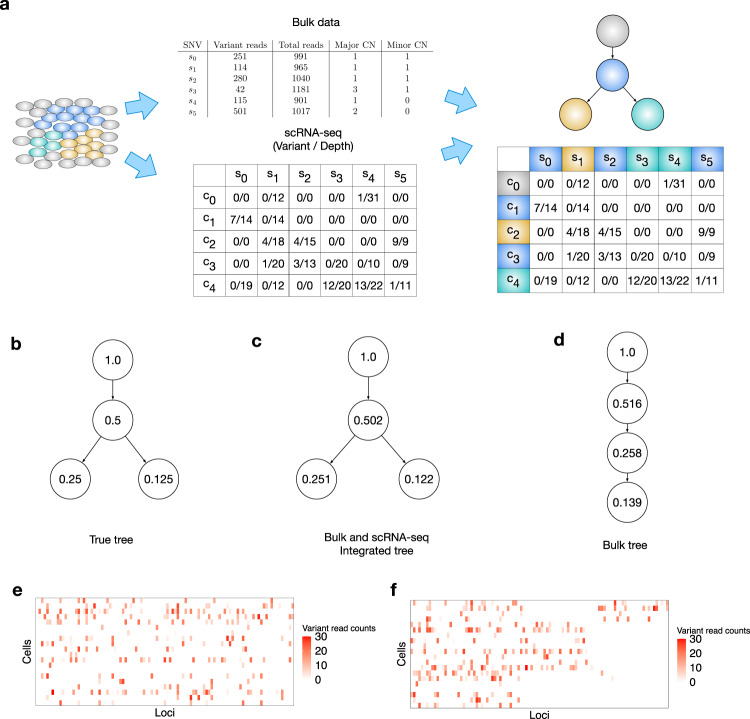
Fig. 1. Overview of PhylEx.
a Schematic diagram describing the bulk DNA-seq and scRNA-seq data input. The output of PhylEx includes the tree and assignment of SNVs and cells to clones. b The cherry shaped tree used in the illustrative example for identifying branching structure from scRNA-seq. The true values of the cellular prevalences are indicated for each clone. c Inferred tree and cellular prevalences from integrated analysis of bulk DNA-seq and scRNA-seq. d Inferred tree and cellular prevalences using bulk DNA-seq. e The heatmap of the variant read counts of single-cells across loci and f. the heatmap of the variant read counts of single cells after co-clustering of cells and SNVs using PhylEx. All the cells share common set of ancestral SNVs and we can see two clusters of cells based on their clonal membership. Source data for e, f are provided as a Source Data file.

