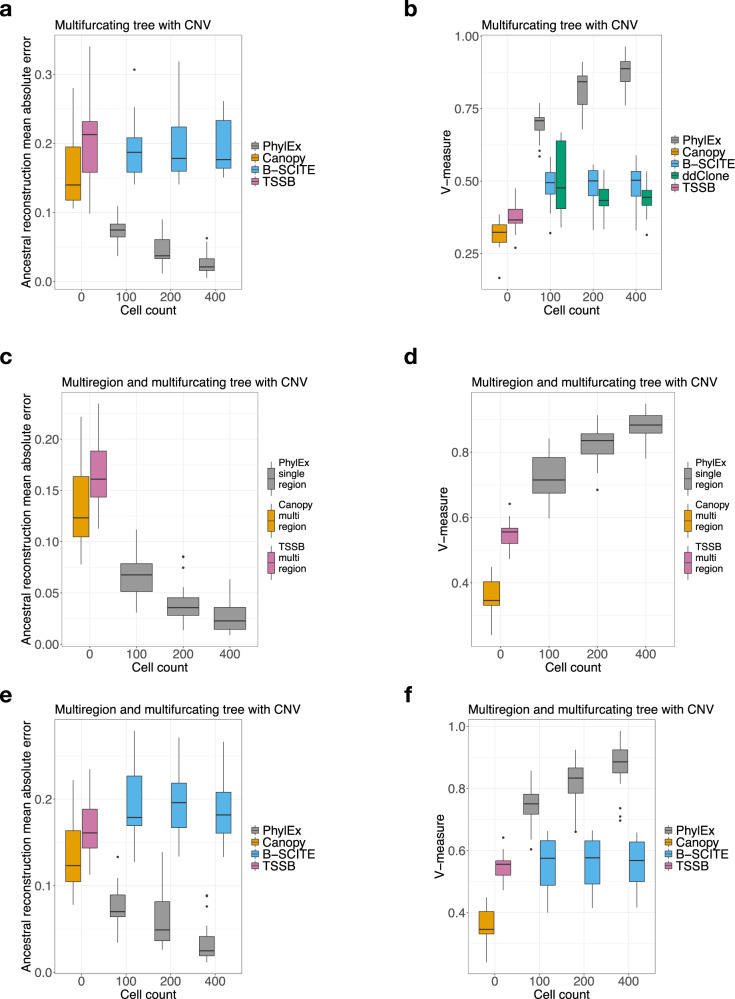
Fig. 2. Simulated data analysis results with 20 data replicates generated with 100 SNVs in each replicate from multifurcating tree with copy number evolution.
a, b Compared PhylEx to competitors on tree reconstruction error and on V-measure. c, d Comparison of PhylEx using single-region bulk DNA-seq and scRNA-seq to bulk-based methods supplied with multi-region DNA-seq using tree reconstruction error and V-measure. e, f Comparison of PhylEx on multi-region bulk DNA and scRNA data to the competitors. The box plot shows the median and inter-quantile range (IQR) at the 1st and the 3rd quantiles; the top (bottom) whisker indicates the maximal (minimal) point no further than 1.5 × IQR from the third (first) quantile. Source data are provided as a Source Data file.

