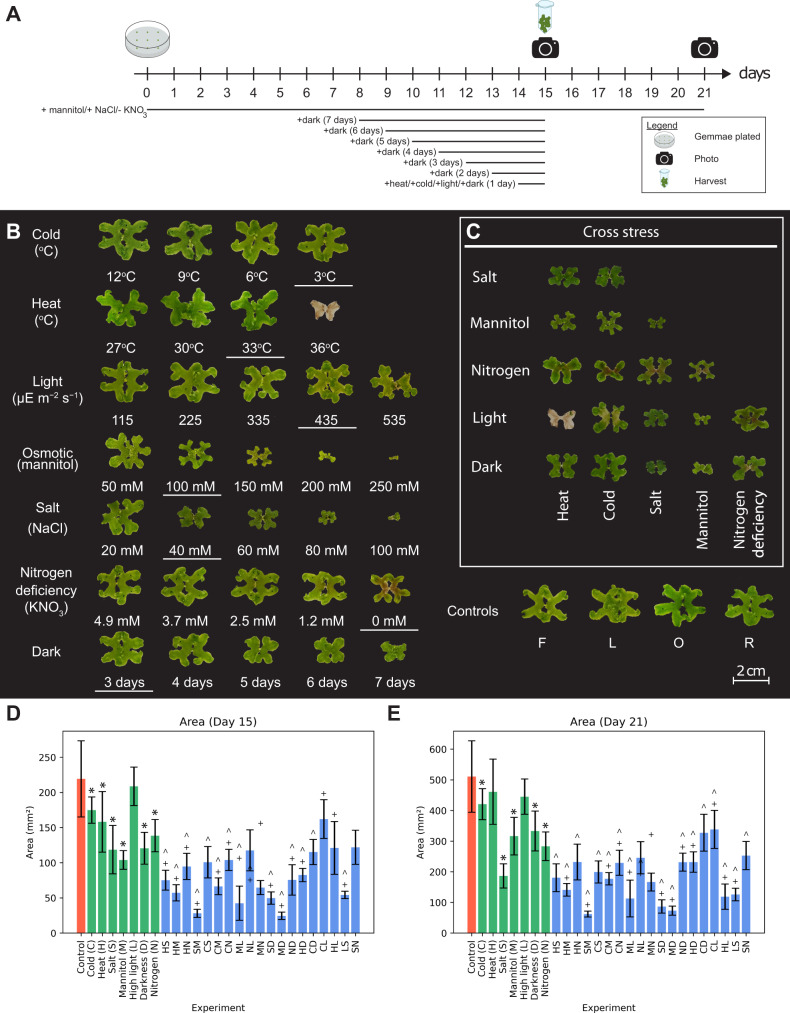
Fig. 1. Influence of different abiotic stresses on the growth of Marchantia.
a Overview of the experimental setup for stress experiments. Black lines below the timeline indicate the duration where plants were exposed to stress. Plants were sampled on day 15. Cultures for observation were returned to normal growth conditions on day 15, and photographs of the cultures were taken on days 15 and 21. b Phenotype of plants on day 21 for heat, cold, osmotic, salt, light, darkness, and nitrogen deficiency stresses. Conditions with underlines represent the stress intensities used for combined stress. Representatives of control from batches F and L for independent stresses performed over 14 batches in panel b (Supplementary Fig. 1 and Source Data 1). c Phenotypes of plants on day 21 for combined stresses. Representatives of control from batches O and R for combined stresses performed over 9 batches in panel c (Supplementary Fig. 1 and Source Data 1). d, e Thallus size of gemmalings on Days 15 and 21. Error bars are represented by standard deviation and Student’s two-tailed t-test, p-value < 0.05. Asterisk (*) represents a significant difference to control, caret (^) represents a significant difference to the first single stress control, and plus sign (+) indicates a significant difference to the second single stress control. The data comprises 131 samples (Control), 8 samples (Cold, Light, Dark), 9 samples (Heat, Salt, Mannitol, HS, HM, HN, SM, ML, NL, MN, SD, MD, ND, HD, CD, CL, HL, LS, SN) and 7 samples (Nitrogen, CS, CM).

