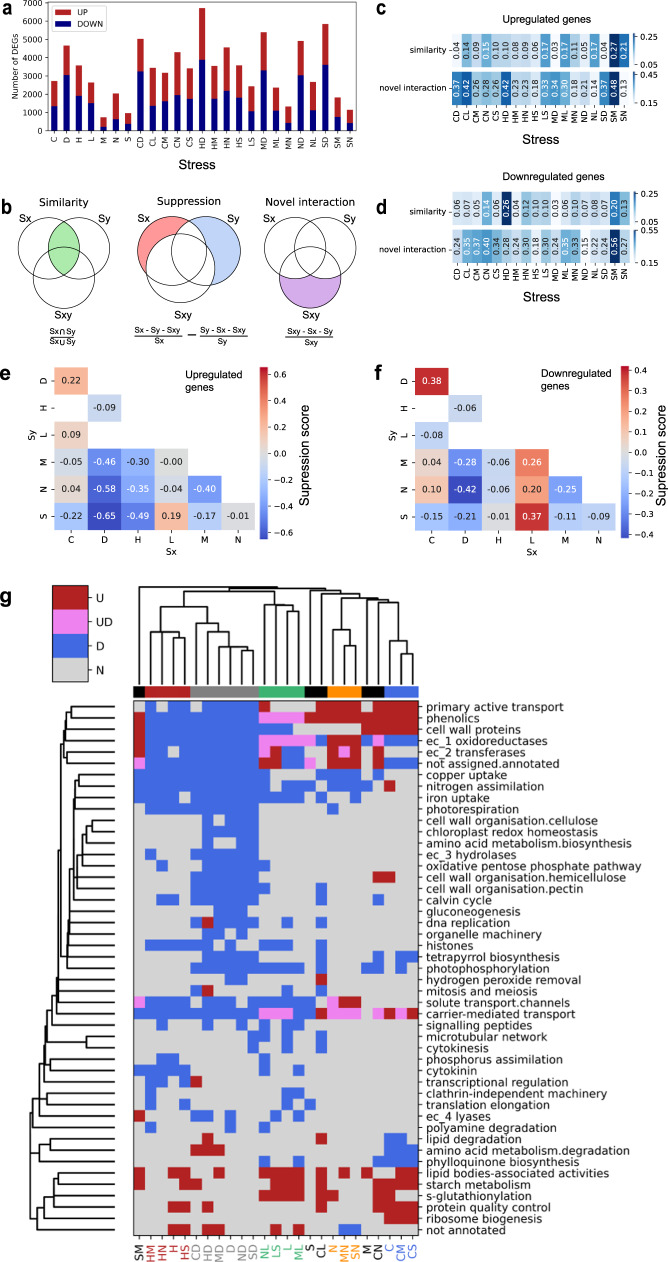
Fig. 2. Analysis of differentially expressed genes and biological pathways.
a The number of significantly (BH-adjusted p-value < 0.05) upregulated (red) and downregulated (blue) differentially expressed genes. The stresses are (C)old, (D)arkness, (H)eat, (L)ight, (M)annitol, (N)itrogen deficiency, and (S)alt. b Illustration and equation of metrics used to measure similarity between two stresses (left), suppression of one stress when two stresses are combined (middle), and novel genes that are differentially regulated when stresses are combined (right). Similarity and novel interaction between independent and cross stresses for c upregulated genes and d downregulated genes. In each stress combination, the first (Sx) and second (Sy) stress corresponds to the first and second letter of the combined (Sxy) stress, respectively. The values were calculated from the equations given in b. Suppression analysis for e upregulated and f downregulated genes. A darker shade of red and blue indicates that more genes from the first (Sx) and second (Sy) stress are not represented in the combined stress (Sxy), respectively. The values were calculated from the equations given in b. g Biological processes that were significantly differentially expressed (hypergeometric test with 1000 permutations, BH-adjusted p-value < 0.05). For brevity, we only show Mapman bins that were differentially expressed in at least three stress perturbations. The groups of stresses are color-coded. Abbreviations used to describe the categories of regulation are upregulation (‘U’, red), up and downregulation (‘UD’, purple), downregulation (‘D’, blue), and no change (‘N’, gray).

