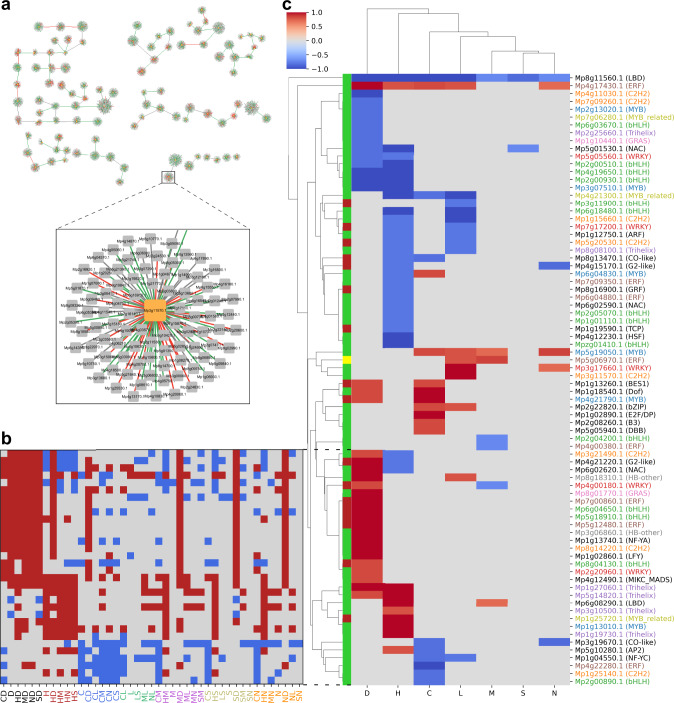
Fig. 3. Identification of robustly-responding transcriptional activators and repressors.
a Gene regulatory network constructed from the union of the seven stress-specific networks. For each of the 6257 differentially expressed genes, we kept models with R2 > 0.8 and selected one TF with the highest absolute relative coefficient. Orange and gray nodes represent TFs and genes, respectively, while green and red edges represent positive and negative coefficients, respectively. b Differential expression patterns of TFs across stress groups. Red, blue, and gray indicate significantly up-, down-regulated, and unchanged expression, respectively. Stresses are colored according to the stress groups. c Identification of 75 robustly-responding TFs across the stresses. For clarity, cells with specificity scores <0.7 are masked. Red and blue cells indicate the degree of up- and down-regulation, respectively. Green, red, and yellow colors on the leftmost column of the plot represent the most commonly observed relationship between TF and gene, which corresponds to an activator, repressor, and ambiguous (positive and negative coefficients observed for the same TF-gene pair in different stress-specific networks) respectively. TFs are colored according to their TF family for TFs that are represented at least thrice.

