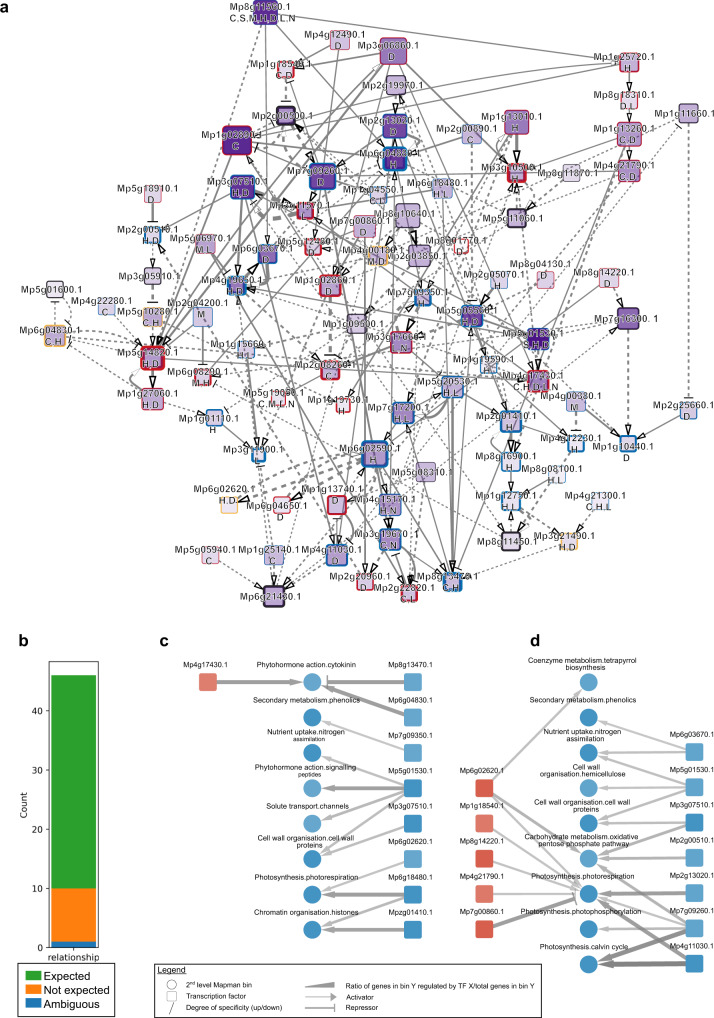
Fig. 4. Analysis of stress-responsive transcription factor regulatory network.
a Transcription factor regulatory network comprising of TFs differentially regulated in at least five experiments. Labels below the gene name indicate robustly-responding TFs in (C)old, (D)arkness, (H)eat, (L)ight, (M)annitol, (N)itrogen deficiency, and (S)alt. Pointed and blunt arrows correspond to transcription activators and repressors respectively. Darker node colors indicate a higher number of genes a TF is regulating, while the node sizes indicate the number of TFs the node is regulating. Node border width indicates the number of incoming regulatory signals of the TF. Red, blue, and yellow node border colors indicate TFs that are robustly upregulated, downregulated, or both. Thicker edges indicate higher absolute coefficients, where pointed and blunted arrows represent positive and negative coefficients, respectively. Solid and dashed edges represent expected and unexpected regulations, respectively. b The number of expected, unexpected, and ambiguous gene regulatory relationships between TFs and MapMan bins. Only edges between TFs controlling ≥5% of genes in a MapMan bin are used. Identification of TFs that regulate biological processes during c heat stress and d darkness. Red and blue nodes indicate robustly up- and down-regulated second-level MapMan bins, respectively. Edge thickness represents the percentage of genes controlled by a TF, in a given MapMan bin, with thicker edges indicating a higher percentage. Pointed and blunt arrows indicate that a TF is an activator or repressor of a given process.

