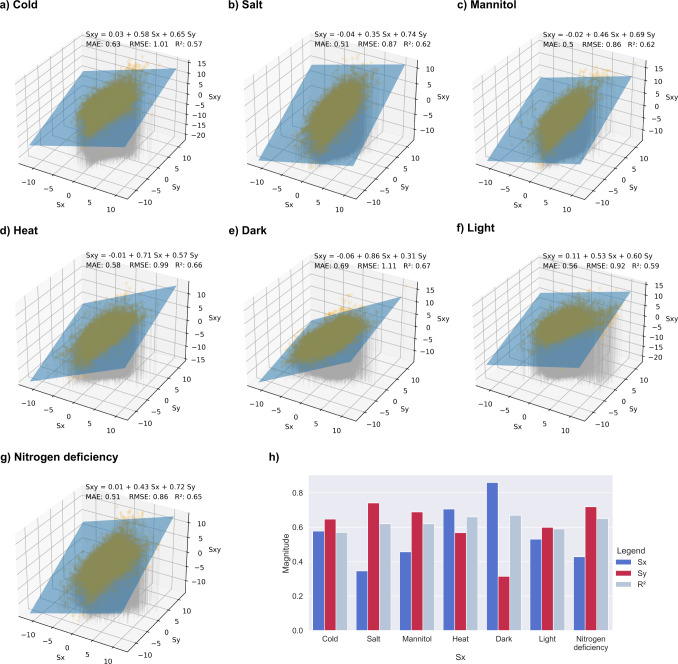
Fig. 7. Stress-specific linear regression analysis.
Sx indicates log2fc from the specific stress, Sy indicates log2fc from all other stresses, and Sxy represents the log2fc from the combined stresses. The Sx stresses are a Cold, b Salt, c Mannitol, d Heat, e Dark, f Light, and g Nitrogen deficiency. h Summary of the linear regression coefficients and model prediction quality. The blue and red bars indicate the Sx and Sy coefficients, respectively, while the light blue bar indicates the R2 value.

