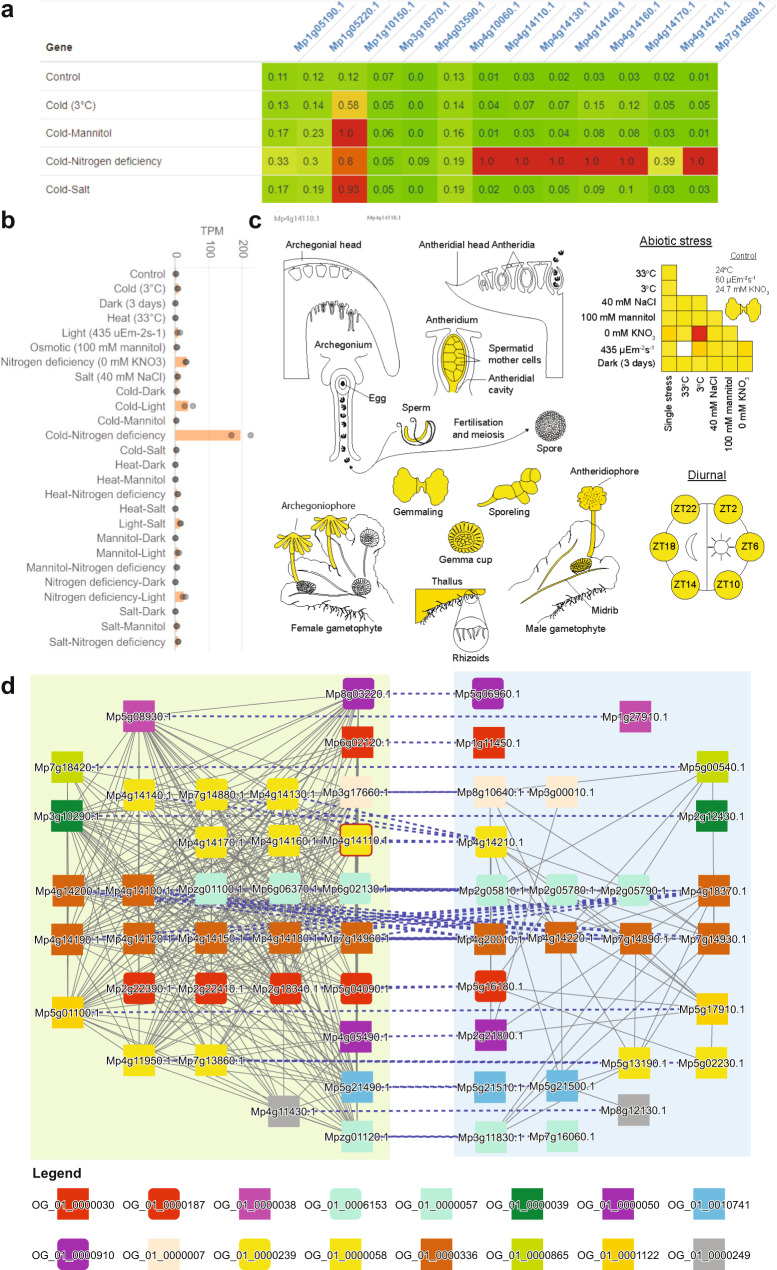
Fig. 8. Implementation of the Marchantia gene expression data in CoNekT and eFP browser.
a Heatmap showing expression of PALs in representative stresses. b Expression profile of Mp4g14110.1 (MpPAL7) under single and combined stress in CoNekt. c Expression of MpPAL7 in different organs and under different abiotic stress conditions in eFP. d Comparison of Cluster 102 and 50 bounded by green and blue boxes, respectively. The border of node MpPAL7 is colored red, and blue dashed lines indicate homology between genes from the two clusters.

