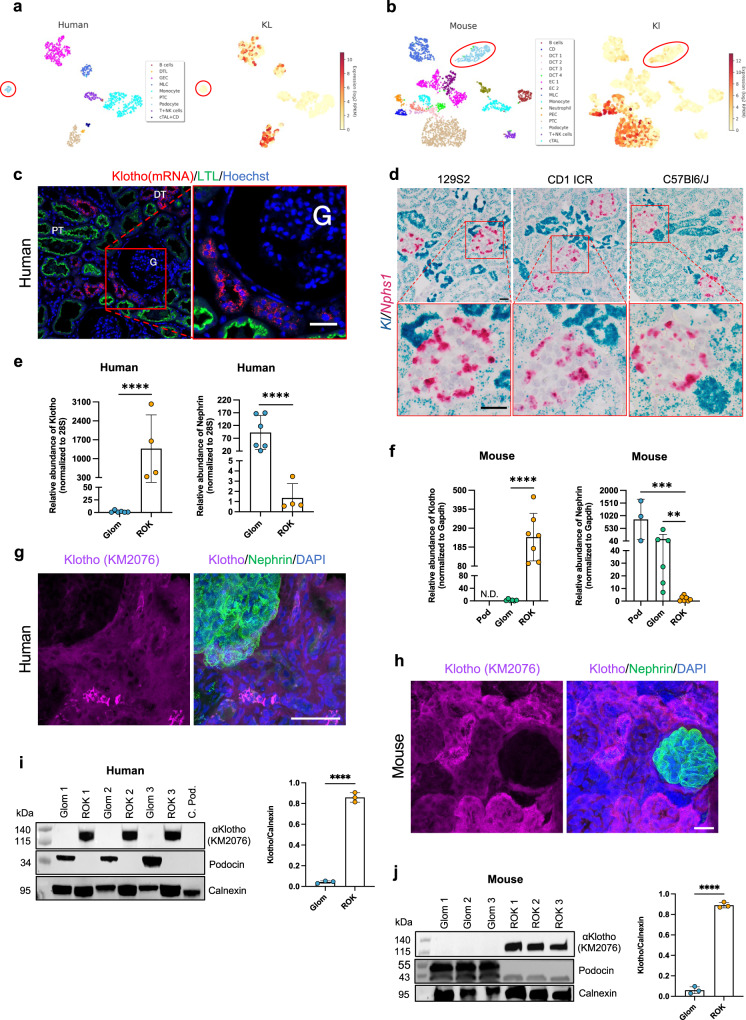
Fig. 1. Expression of Klotho in normal human and mouse kidneys.
a, b Human and mouse single-cell RNA-sequencing data extracted from Kidney glomerular single-cell atlas (data available at https://patrakkalab.se/kidney/). The left panels show a t-SNE plot of cell clusters based on the identification of highly expressed specific cell markers (left panels in supplementary Fig. 1). The t-SNE plot (right panels) shows that Klotho expression in the different clusters. The podocytes circled in red. DTL: descending thin limb of Henle’s loop; GEC: glomerular endothelial cells; MLC: Mesangial-like cells; PTC: Proximal tubular cells; T + NK: T + natural killer lymphocytes; cTAL + CD: cortical thick ascending limb of Henle’s loop + collecting duct. CD: collecting ducts; DCT: distal convoluted tubules; EC: endothelial cells; PEC: glomerular parietal epithelial cells; cTAL: cortical thick ascending limb of Henle’s loop. c In situ hybridization of human kidney cortex where Klotho (red) was co-labeled with Lotus tetragonolobus lectin (LTL, green) and Hoechst (blue). d In situ hybridization of mouse kidney cortex from 3 different strains (129S2, CD1 ICR, C57BL6/J) where Klotho (blue) and Nephrin (pink) were labeled. e, f RT-qPCR for Klotho in rest of kidney (ROK), glomerular (glom) fraction and in (f) FAC sorted mouse podocytes (Pod). 28S (e) and GAPDH (f) genes were used as a housekeeping gene and nephrin to validate the purity of glomerular fraction and isolated podocytes. Values are expressed as mean ± SD (n = 3). **p < 0.01; ***p < 0.001; ****p < 0.0001. g, h Dual labeling with a podocyte marker nephrin (green) and Klotho (purple) in both human (g) and mouse (h). i, j Western blotting in the rest of kidney (ROK) and glomeruli fraction (Glom). Calnexin was used as a loading control and podocin antibody validates the purity of isolated glomeruli. Data are expressed as mean ± SD (n = 3). ****p < 0.0001. Scale bars: 100 μm (c); 20 μm (d), 50 μm (g), 20 μm (h). Statistical significance between groups was determined using unpaired t-test; more than 2 groups were compared with one-way ANOVA.

