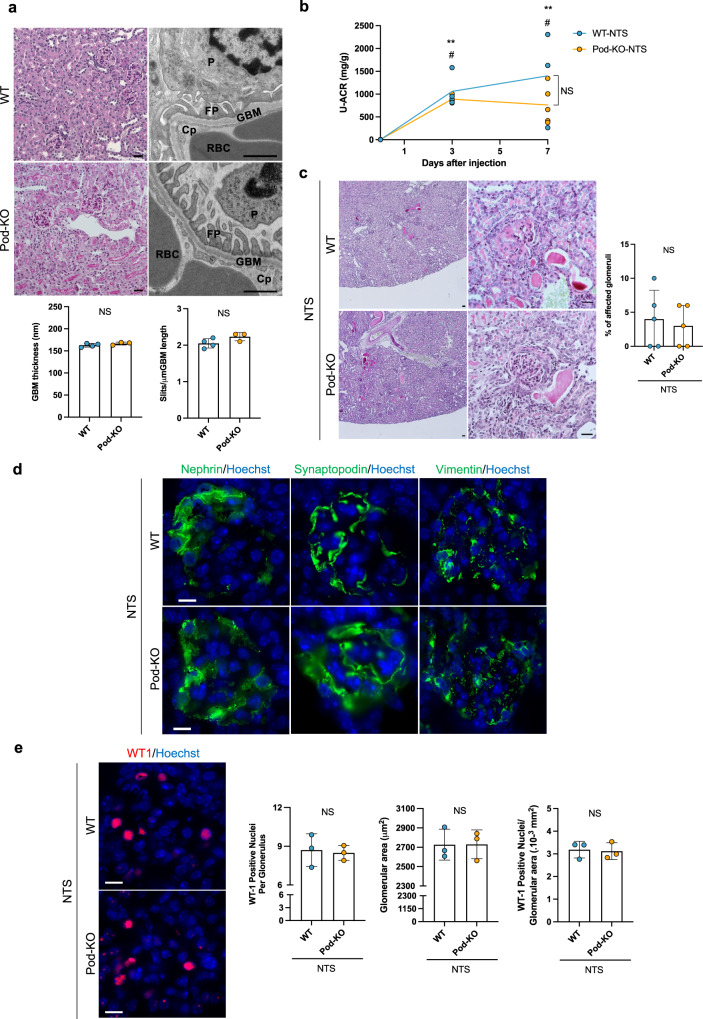
Fig. 2. Characterization of Pod-KO at baseline and after NTS-induced injury.
a Representative images of PAS staining (left panels) from 5-month-old Pod KO mice. Transmission electron microscopy examination (right panels) and quantification of mean glomerular basement membrane (GBM) thickness and the number of slits per μm GBM in WT and Pod-KO mice. Cp: capillary lumen, FP: foot process, GBM: glomerular basement membrane, P: podocyte, RBC: red blood cell. NS: not significant. b Urinary albumin/creatinine ratios (U-ACR) in WT and Pod-KO mice, 0 day (n = 4 WT; n = 5 Pod-KO), 3 days (n = 4 WT; n = 3 Pod-KO), and 7 days (n = 3 WT; n = 5 Pod-KO) after injection of NTS. **p < 0.01 WT day 0; ##p < 0.01 vs. Pod-KO day 0. NS: Not significant. c PAS staining in WT and Pod-KO glomeruli 7 days after the induction of disease (n = 5). d Immunofluorescent stainings of podocyte-specific markers nephrin, synaptopodin, and vimentin in both WT and Pod-KO after NTS injection. e Immunofluorescent staining of WT1. The number of WT-1 positive podocytes (left panel) in glomeruli as well as glomerular area (middle panel) and WT-1 positive podocytes/glomerular area were plotted in WT and Pod-KO after NTS injection. WT-1 positive cells were counted in 20 randomly chosen glomeruli. NS: not significant. Scale bars: 30 μm (PAS), 1 μm (tEM) (a); 50 μm, 30 μm (c); 10 μm (d, e). Statistical significance between groups was determined using unpaired t-test or mixed-effects analysis followed by multiple comparisons.

