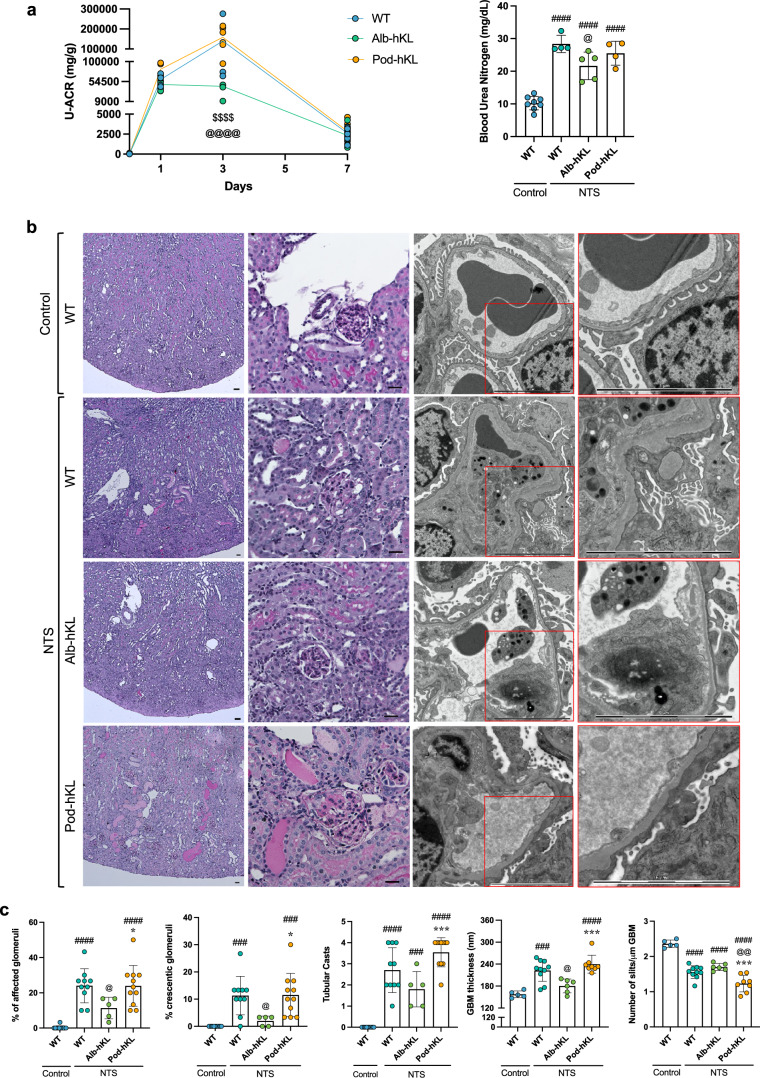
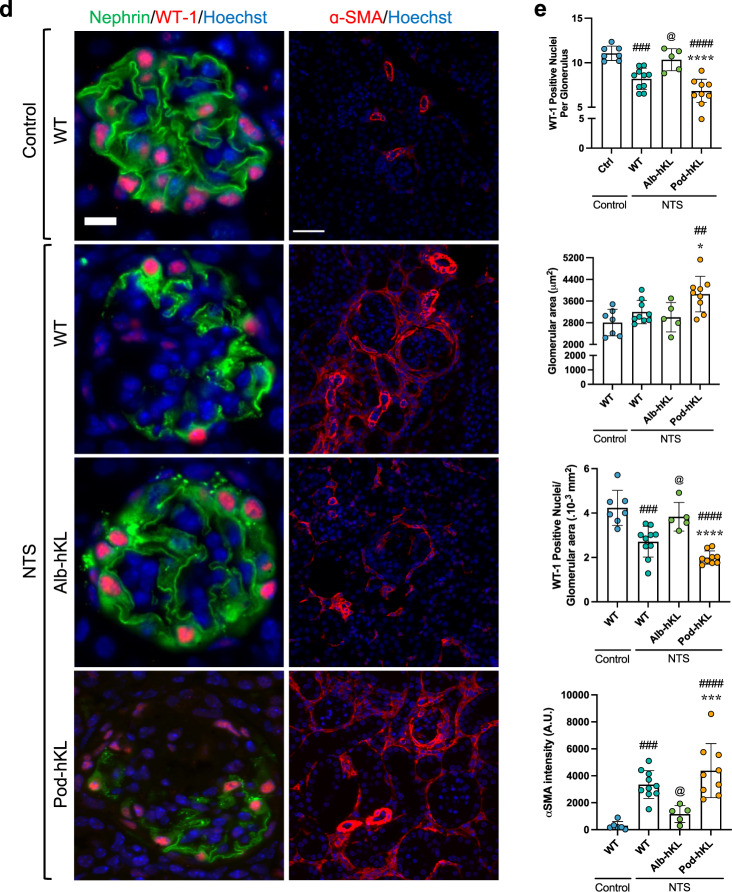
Fig. 4. Hepatocyte-specific overexpression of Klotho ameliorates renal injury and proteinuria in a mouse model of NTS-induced glomerulonephritis.
a Left panel: Urinary albumin/creatinine ratio (U-ACR) in WT, Alb-hKL, and Pod-hKL, 0, 1, 3, and 7 days after injection of NTS. $$$$p < 0.0001 vs. Pod-hKL and @@@@p < 0.0001 vs. WT. Right panel: Blood urea nitrogen in the different groups without injury (control mice) or 7 days after injection of NTS (NTS mice). ####p < 0.0001 vs. WT-control; @p < 0.05 vs. WT-NTS. b Representative images of PAS (left panels) and TEM (right panels) of kidney cortex from WT-control and WT, Alb-hKL, Pod-hKL 7 days after NTS injection. c Percentage of affected and crescentic glomeruli were quantified from 30 randomly selected glomeruli in the corresponding PAS staining. Tubular casts were assessed over the whole cross-section giving a score between 0, no cast to 5, >80% of the tubules are affected (n = 11 WT-control; n = 10 WT-NTS; n = 5 Alb-hKL-NTS; n = 11 Pod-hKL-NTS). Quantification of mean glomerular basement membrane (GBM) thickness and the number of slits per μm GBM (n = 5 WT-control; n = 10 WT-NTS; n = 6 Alb-hKL-NTS; n = 8 Pod-hKL-NTS). ###p < 0.001, ####p < 0.0001 vs. WT-control; @p < 0.05, @@p < 0.01 vs. WT-NTS and *p < 0.05, ***p < 0.001 vs. Alb-hKL-NTS. d Representative images of immunofluorescent stainings of Nephrin, WT-1, and α-SMA in the different groups. e Quantification of the number of WT-1 positive podocytes in glomeruli (left panel), glomerular area (middle panel), and WT-1 positive podocytes/glomerular area (right panel) (n = 7 WT-control; n = 9 WT-NTS; n = 5 Alb-hKL-NTS; n = 9 Pod-hKL-NTS). α-SMA positive area was counted per cortical cross section (10 sections per sample; n = 6 WT-control; n = 10 WT-NTS; n = 5 Alb-hKL-NTS; n = 9 Pod-hKL-NTS). ##p < 0.01, ###p < 0.001, ####p < 0.0001 vs. WT-control; @p < 0.05 vs. WT vs. WT-NTS and *p < 0.05, ***p < 0.001, ****p < 0.0001 vs. Alb-hKL-NTS. Scale bars: 50 μm, 30 μm, 5 μm (b), 10 μm, 50 μm (d). Statistical significance between groups was determined using one-way or two-way repeated measures ANOVA followed by multiple comparisons.


