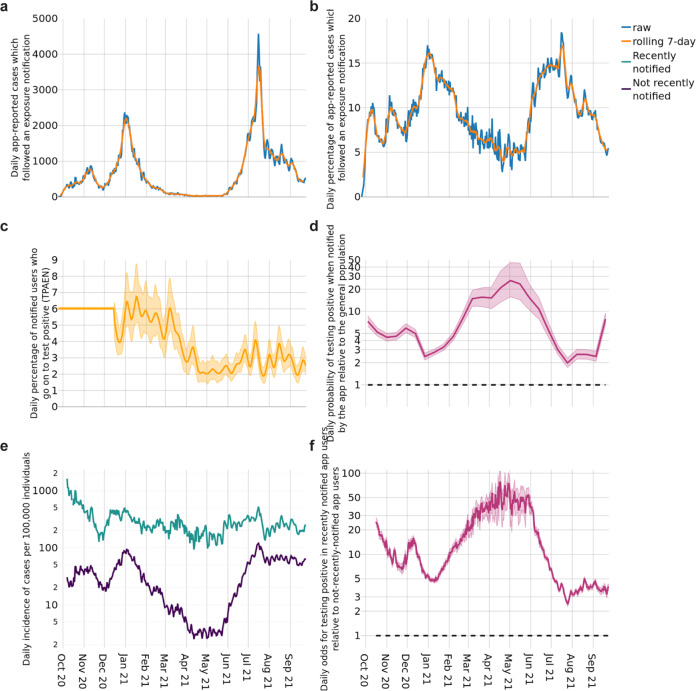
Fig. 5. Testing positive after exposure notification.
a The daily number of app-reported cases which followed an exposure notification, and rolling 7-day average. b The daily and rolling 7-day average percentage of app-reported cases which followed an exposure notification. c The mean estimated proportion of notified individuals who enter a positive test result into the app shortly after exposure notification (TPAEN). Shading around the line indicates the 95% credible interval. d The probability of testing positive after notification relative to a random member of the 16+ population, shown on a logarithmic scale. The central estimate and shading around the line correspond to the uncertainty reported for the ONS infection survey (official estimate and 95% credible interval respectively). The horizontal dotted line indicates a value of 1, i.e., equal probability. e Daily new app-reported cases per 100,000 active users by notification status. f Daily maximum likelihood estimates of the odds for testing positive in recently notified app users relative to not-recently-notified app users. Shading indicates 95% confidence intervals. The horizontal dotted line indicates a value of 1, i.e., equal probability.

