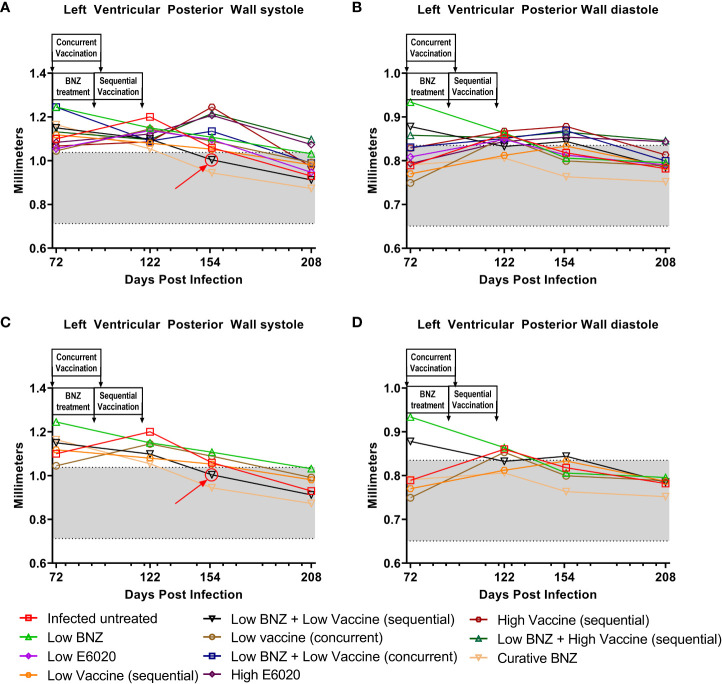
Figure 3.
Left ventricular posterior wall thickness (LVPW) after treatment. M-mode images from echocardiographic examination were used to measure LVPW in infected untreated and treated mice at 70dpi, 122dpi, 154dpi and 208dpi during both systole (A) and diastole (B). Panels (C) and (D) illustrate only a subset of treatment groups to better visualize treatment differences between key groups. The grey shaded area represents the mean ± SD of the LVPWs and LVPWd measurement from naïve age matched controls.

