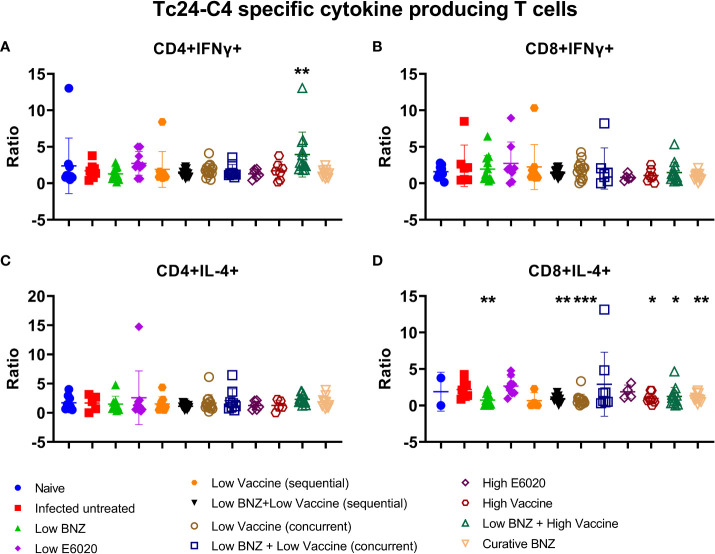
Figure 8.
Antigen specific cytokine producing T cells. Splenocytes were restimulated in vitro with recombinant Tc24-C4 protein or cRPMI alone (unstimulated), then stained with fluorescent antibodies for analysis by flow cytometry as described. Results are expressed as a ratio of antigen specific cells divided by unstimulated cells. (A) CD4+IFNγ+ cells, (B) CD8+IFNγ+ cells, (C) CD4+IL-4+ cells, (D) CD8+IL-4+ cells. When comparing groups to the infected untreated control *, p≤0.05; **, p≤0.01; ***, p≤0.001.

