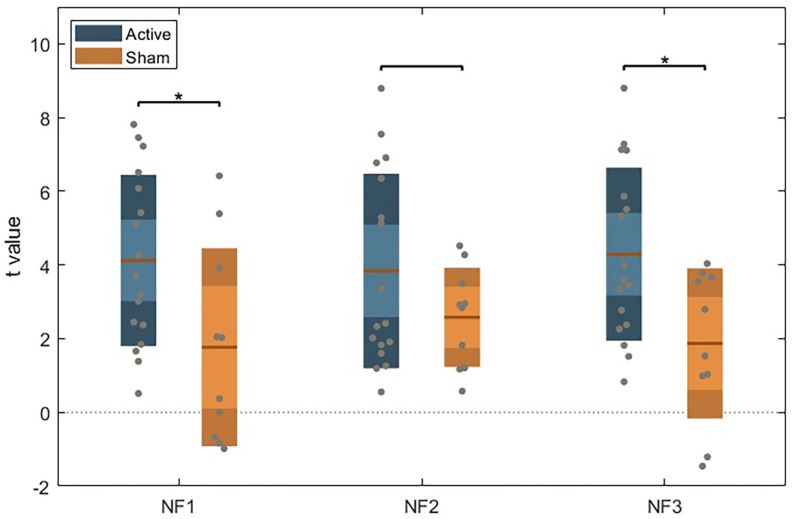
Figure 3.
Unpaired t-test between the active and sham group for each NF run, using Bonferroni’s correction. Dark color areas represent one standard deviation; light color areas represent the 95% confidence interval for the mean. Gray dots represent data for each subject. The brown line is the mean for each group.

