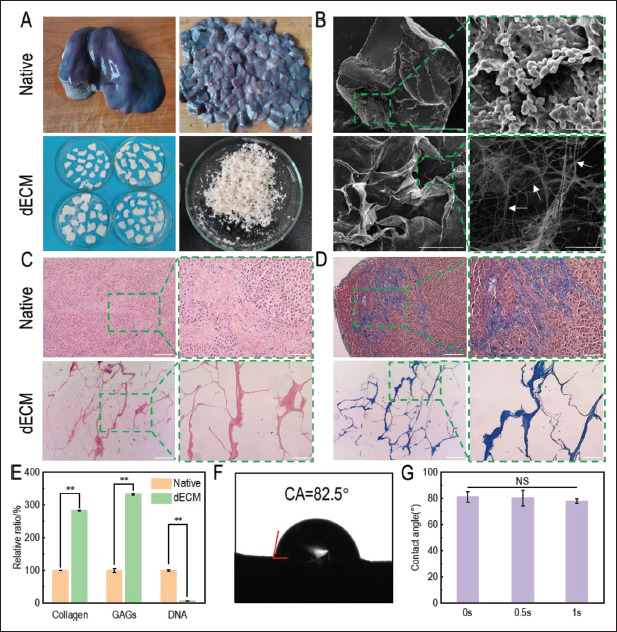
Figure 1.

Characterization of porcine liver tissues before and after decellularization. (A) Macrostructure of tissues before and after decellularization. (B) Microstructure of tissues observed by scanning electron microscope. Images on the left (scale bar: 100 μm) were enlarged and shown on the right (scale bar: 50 μm). White arrows: fibers. (C) H&E staining (red: nuclear; blue: extracellular matrix) and (D) Masson staining (red: actin; blue: collagen) of tissues before and after decellularization were performed. Images on the left (scale bar: 400 μm) were enlarged and shown on the right (scale bar: 100 μm). (E) The relative contents of collagen, GAGs, and DNA after decellularization were investigated by standard curve method. **P<0.01, represents significant difference between two groups. (F) Water contact angle of dECM at 0 s. (G) Water contact angles at 0 s, 0.5 s, and 1 s. NS indicated that no significant difference existed between different groups.
