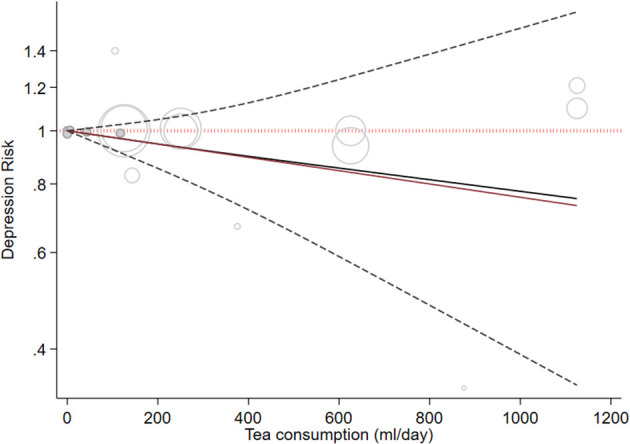
Figure 4.

Dose-response association between tea intake and depressive symptoms. The solid line represents a non-linear dose response, and the dotted lines represent a 95% confidence interval. Circles represent hazard ratio point estimates for coffee intake categories from each study with circle size proportional to the inverse of standard error.
