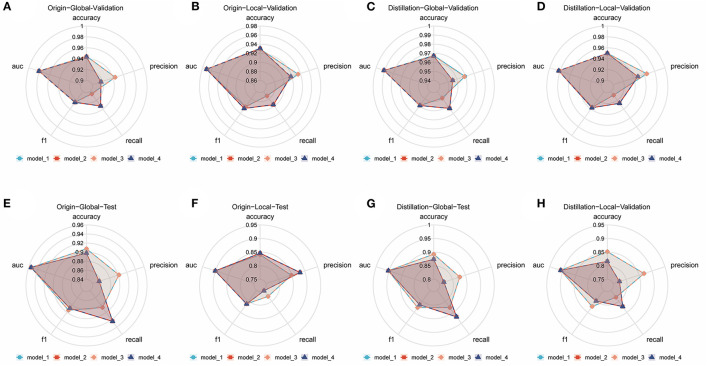
Figure 1.
Comparison of different ensemble DL models in each internal validation dataset and external test dataset. (A) Comparative radar plot of different ensemble DL models in the origin-global internal validation dataset. (B) Comparative radar plot of different ensemble DL models in the origin-local internal validation dataset. (C) Comparative radar plot of different ensemble DL models in the distillation-global internal validation dataset. (D) Comparative radar plot of different ensemble DL models in the distillation-local internal validation dataset. (E–H) show the comparison of the performance of the models validated in the above dataset in the external test dataset (Model 1, model 2, model 3, and model 4 represent the models with the top 5 AUCs in each dataset using different methods of integration). Model 1: the prediction results of the 5 sub-models are directly averaged with a classification threshold of 0.5. Model 2: the prediction results of the five sub-models are directly averaged with a classification threshold of the optimal cut-off value in the training set. Model 3: the prediction results of the 5 sub-models are weighted and averaged with a classification threshold of 0.5. Model 4: the prediction results of the 5 sub-models are weighted and averaged with a classification threshold of the optimal cut-off value in the training set.

