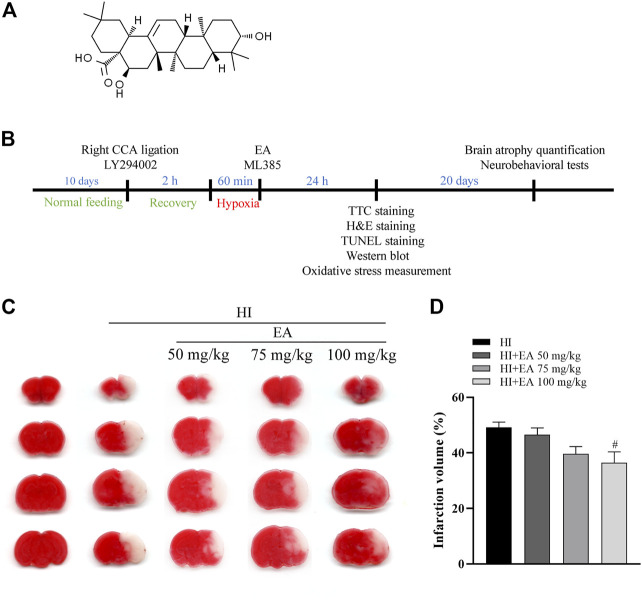
FIGURE 1.
Effects of EA on cerebral infarction following HIBD. (A) The chemical structure of EA. (B) Schedule of the surgery, treatment protocols and experimental tests in vivo study. (C) Representative images of TTC-stained coronal brain sections from the sham group, HI group and groups treated with different doses of EA. (D) Quantitative analysis of the brain infarct volume. Data are presented as the means ± SEM, n = 10. # p < 0.05 vs. the HI group.

