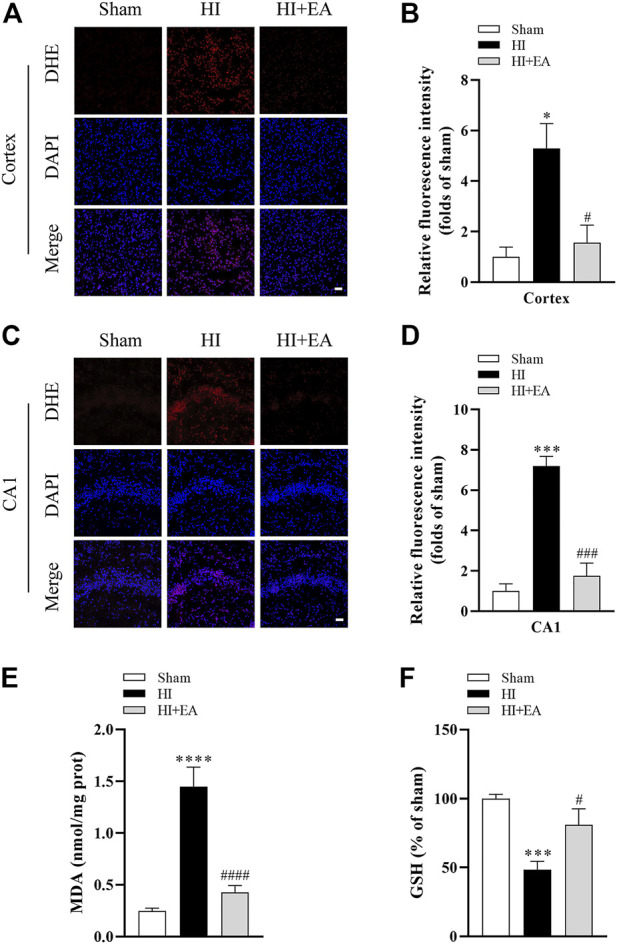
FIGURE 3.

Effects of EA on oxidative stress following HIBD. (A) Representative pictures of DHE staining in the ipsilateral parietal cortex (scale bar: 20 μm). (B) Semiquantitative analysis of the DHE fluorescence intensity in the ipsilateral parietal cortex, n = 3. (C) Representative pictures of DHE staining in the CA1 area of hippocampus (scale bar: 20 μm). (D) Semiquantitative analysis of the DHE fluorescence intensity in the hippocampal CA1 region, n = 3. (E,F) Levels of MDA and GSH, n = 6. Data are presented as the means ± SEM. *p < 0.05, ***p < 0.001, ****p < 0.0001 vs. the sham group; # p < 0.05, ### p < 0.001, #### p < 0.0001 vs. the HI group.
