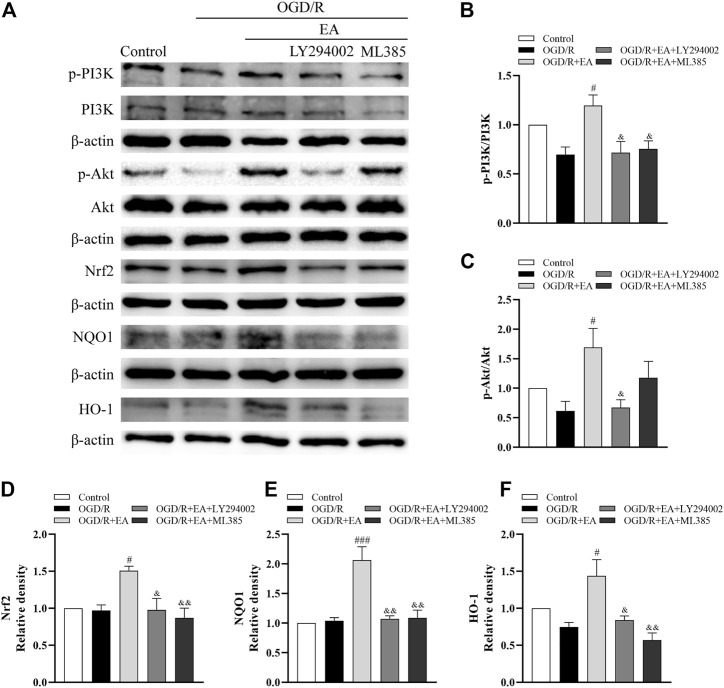
FIGURE 8.
Effects of EA on the PI3K/Akt/Nrf2 signaling pathway following OGD/R. (A) Representative western blot bands of p-PI3K, PI3K, p-Akt, Akt, Nrf2, NQO1, HO-1 and β-actin. (B–F) Western blot analysis of p-PI3K, PI3K, p-Akt, Akt, Nrf2, NQO1, and HO-1, respectively. Data are presented as the means ± SEM, n = 3. # p < 0.05, ### p < 0.001 vs. the OGD/R group; & p < 0.05, && p < 0.01 vs. the OGD/R + EA group.

