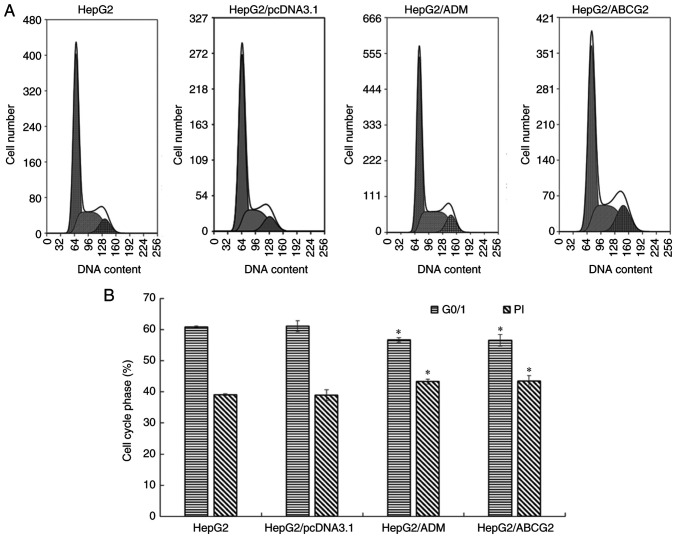
Figure 3.
Cell cycle detected by flow cytometry. (A) The cell cycle distribution was detected by flow cytometry. (B) The results indicated that the G0/G1 phase population of HepG2/ADM and HepG2/ABCG2 cells was significantly lower, while the proliferation index was significantly higher, compared with their parental HepG2 cells and HepG2/pcDNA3.1 cells. Values are expressed as the mean +/- standard deviation (n=3). *P<0.05 vs. HepG2 and HepG2/pcDNA3.1 cells; ADM, Adriamycin; ABCG2, adenosine triphosphate-binding cassette transporter G2; PI, proliferative index.

