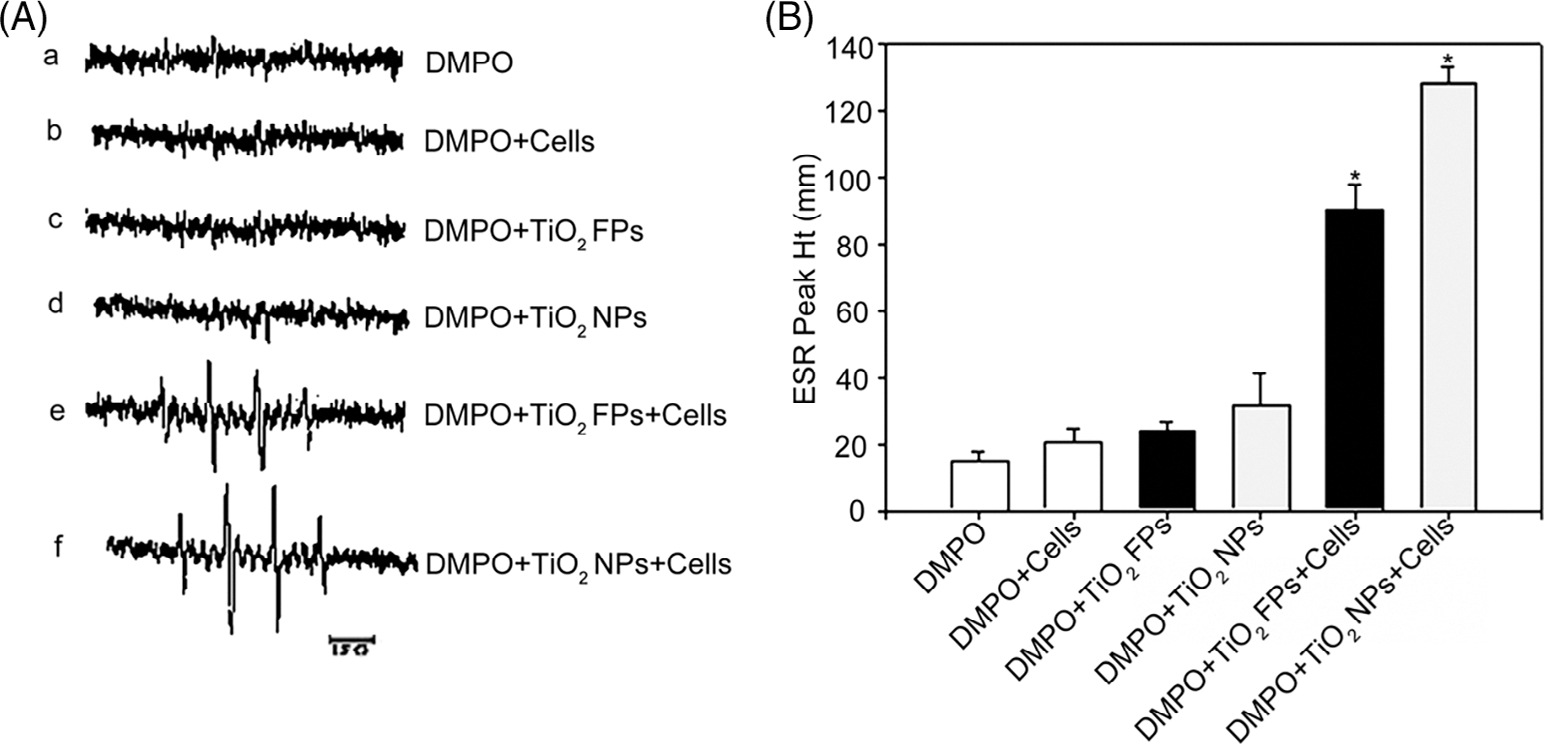
FIGURE 2.

ESR spectra signals (A) and average ESR peak (B) generated by DMPO-OH adducts in different groups. (A) DMPO (200 mM)alone; (B) DMPO (200 mM) + JB6 cells (1 × 10⁶); (C) DMPO (200 mM) + TiO2 FPs (1 mg/ml); (d) DMPO (200 mM) + TiO2 NPs (1 mg/ml); (e) DMPO (200 mM) + JB6 cells (1 × 10⁶) + TiO2 FPs (1 mg/ml); or (F) DMPO (200 mM) + JB6 cells (1 × 10⁶) + TiO2 NPs (1 mg/ml). The average ESR peak was presented as means ± SE (n = 3)
