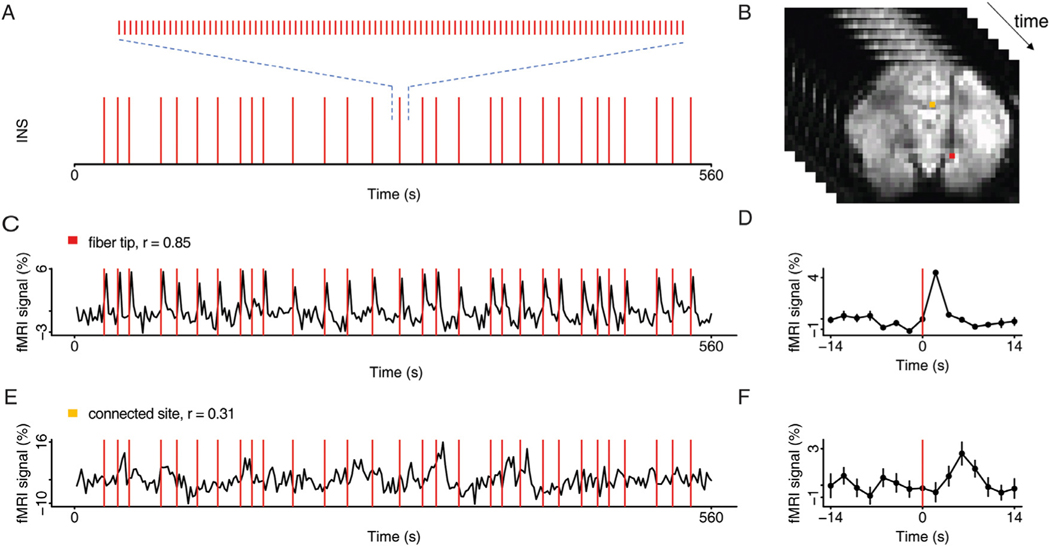
Fig. 3. INS stimulation paradigm.
A. Temporal distribution of INS pulse trains triggered at random onsets. Each pulse train (0.5 s, 200hz, 250us/pulse) consists of 100 laser pulses (shown expanded above). B. Example of functional images acquired over time, with highlights of the activated voxels at the stimulation site (red voxel) and at the presumed connected site (orange voxel) (p < 0.001). C. Time course of the fMRI signals at the laser tip in response to stimulation in A (red voxel in B). Stimulation timepoints (red lines) superimposed on BOLD trace. Correlation values (r) indicated above each trace. D. Time course averaged over repetitions (in C). E. Time course of the fMRI signals at a presumed connected site in response to stimulation in A (orange voxel in B). F. Time course averaged over repetitions (in E). Error bars: SEM. Stimulation intensity 0.5 J/cm2. (For interpretation of the references to color in this figure legend, the reader is referred to the web version of this article.)

