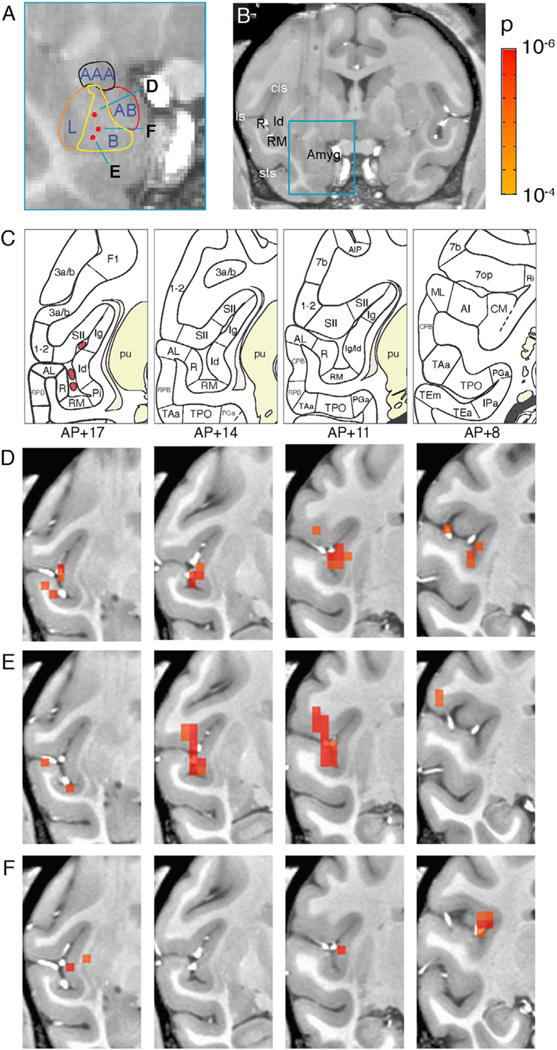
Fig. 7. Topography of cortical connectivity with basal nucleus of amygdala.
A-B. Estimated nuclear boundaries in the amygdala and the anatomical location of three stimulation sites shown as red dots and marked as D, E, and F. C. Parcellation of the insula and the surrounding temporal sulcal areas based on the Saleem and Logothetis atlas. D-F. Series of coronal activation maps corresponding to the stimulation sites D, E, and F in the basal nucleus (panel A). The maps are arranged from left to right in an anterior-to-posterior progression (AP: +17, +14, +11, +8). Voxels thresholded at p < 0.0001 (FDR D: 5.5%, E: 14%, F: 6.7%). Stimulation: block design, 0.1 J/cm2.

