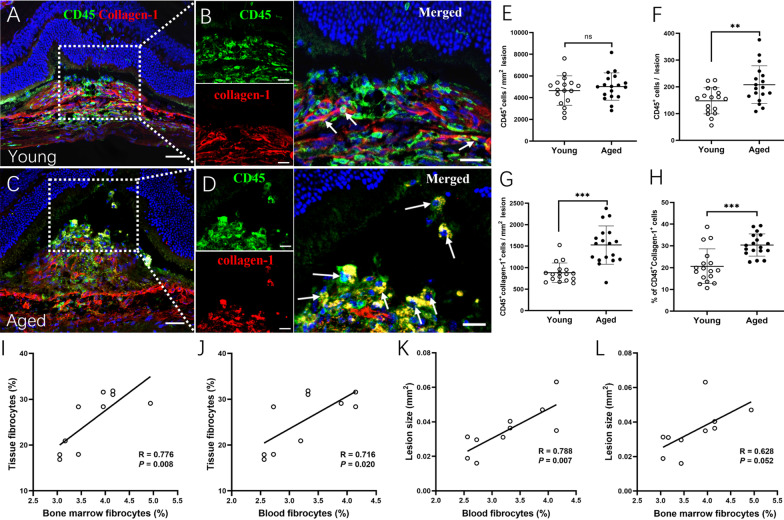
Fig. 3.
Fibrocytes in the subretinal fibrotic lesion in young and aged mice. A Representative confocal image of retinal cryosection from young (2.5-month) mice with subretinal fibrosis stained for nucleus (blue), CD45 (green) and collagen-1 (red). Cell nuclei were stained with 4',6-diamidino-2-phenylindole (DAPI, blue). (B) Magnified area of box in A showing CD45+collagen-1+ cells (arrows) in fibrotic lesion. C Representative confocal image of retinal cryosection from aged (15–16-month) mice with subretinal fibrosis stained for CD45 (green) and collagen-1 (red). (D) Magnified area of box in C showing CD45+collagen-1+ cells (arrows) in fibrotic lesion. A, C Scale bar = 50 µm; B, D Scale bar = 20 µm. E, F Number of CD45+ cells expressed per mm2 area of lesion (E) and per lesion (F) in young and aged mice. G, H Number of CD45+collagen-1+ cells in subretinal fibrotic lesions of young and aged mice. H Percentage of CD45+collagen-1+ cells among all CD45+ cells in subretinal fibrotic lesions of young and aged mice. Mean ± SD, n = 17–18 lesions per group from 5 eyes, **p < 0.01, ***p < 0.001, Student t test. I, J Correlation in the number of CD45+collagen-1+ cells between retinal fibrotic lesion and bone marrow (I) or blood (J). K, L Correlation between subretinal fibrotic lesion size and CD45+collagen-1+ cells in the bone marrow (I) or blood (J)

