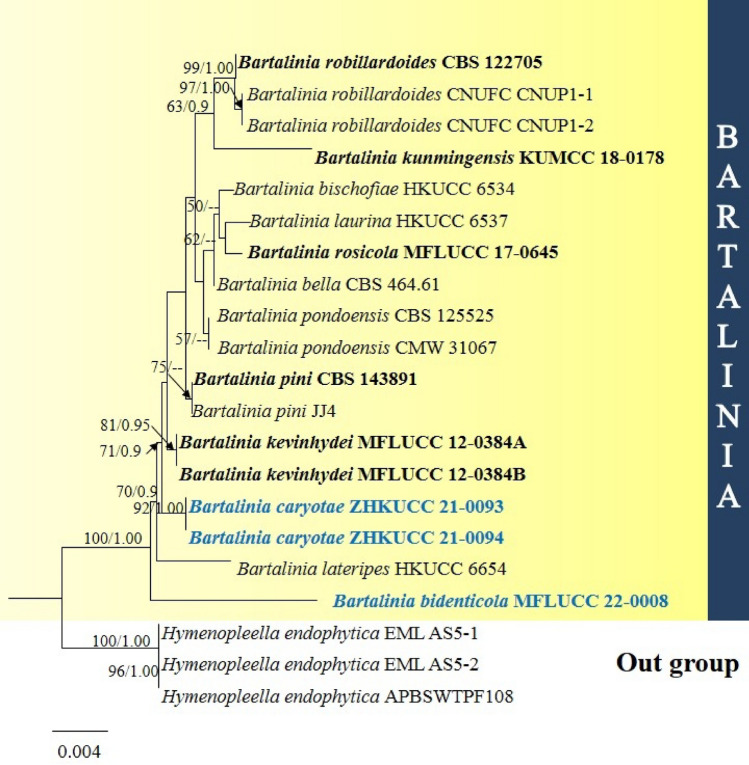
Fig. 118.
Phylogram generated from maximum likelihood analysis based on combined LSU and ITS sequence data for Bartalinia. Twenty taxa were included in the combined analyses, which comprised 1479 characters (LSU = 897 bp, ITS = 582 bp) after alignment. Bootstrap support values for maximum likelihood (ML) ≥ 50% and clade credibility values ≥ 0.90 from Bayesian inference analysis are labelled at each node. Ex-type strains are in bold and the new isolate is indicated in blue bold. Hymenopleella endophytica (APBSWTPF108, EML AS5-1, EML AS5-2) were used as the outgroup taxa

