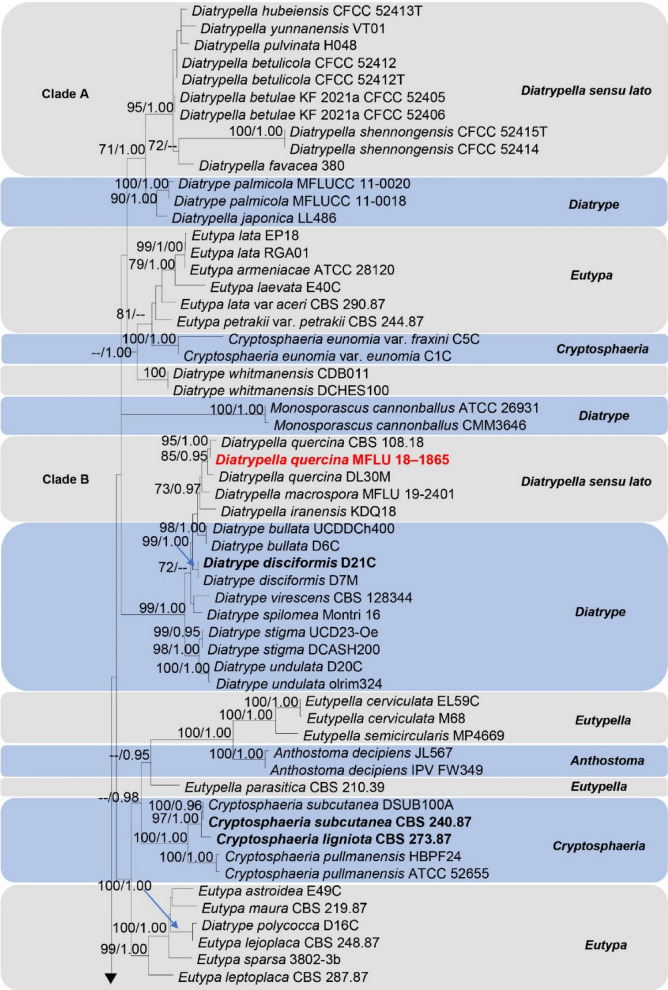
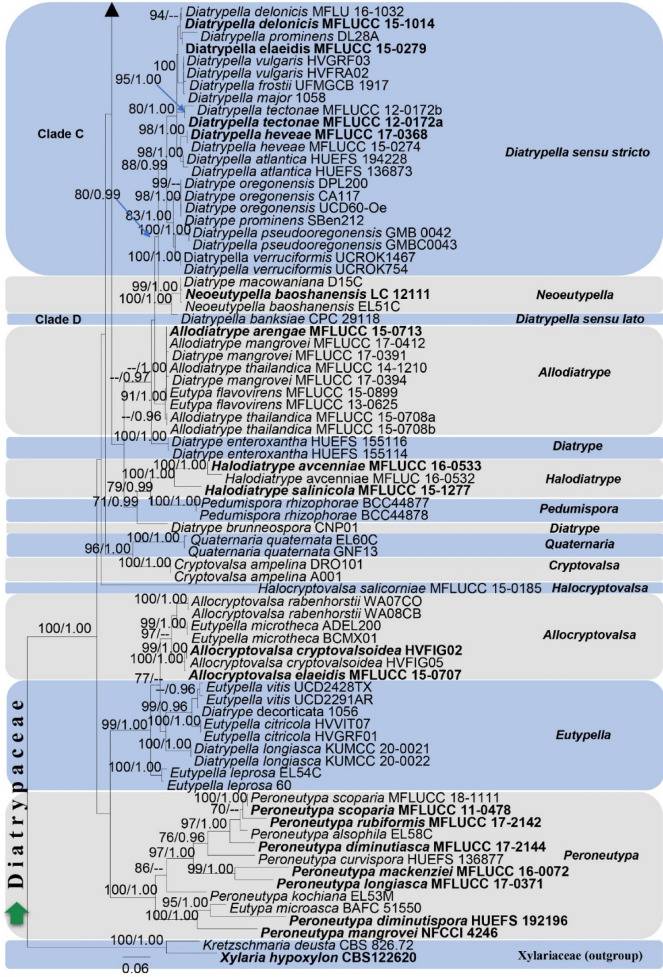
Fig. 125.
Phylogram generated from maximum likelihood analysis based on combined ITS and tub2 sequence data representing Diatrypaceae in Xylariales. Related sequences are taken from Boonmee et al. (2021) and additions according to the BLAST searches in NCBI. Hundred and thirty-five strains are included in the combined analyses which comprised 912 characters (517 characters for ITS and 395 characters for tub2) after alignment. Kretzschmaria deusta (CBS 826.72) and Xylaria hypoxylon (CBS 122,620) in Xylariaceae (Xylariales) were used as the outgroup taxa. Bootstrap support values for ML ≥ 75% are given above the nodes (left side). Bayesian posterior probabilities (BYPP) ≥ 0.95 are given above the nodes (right side). Ex-type strains are in bold and newly generated sequence is in red


