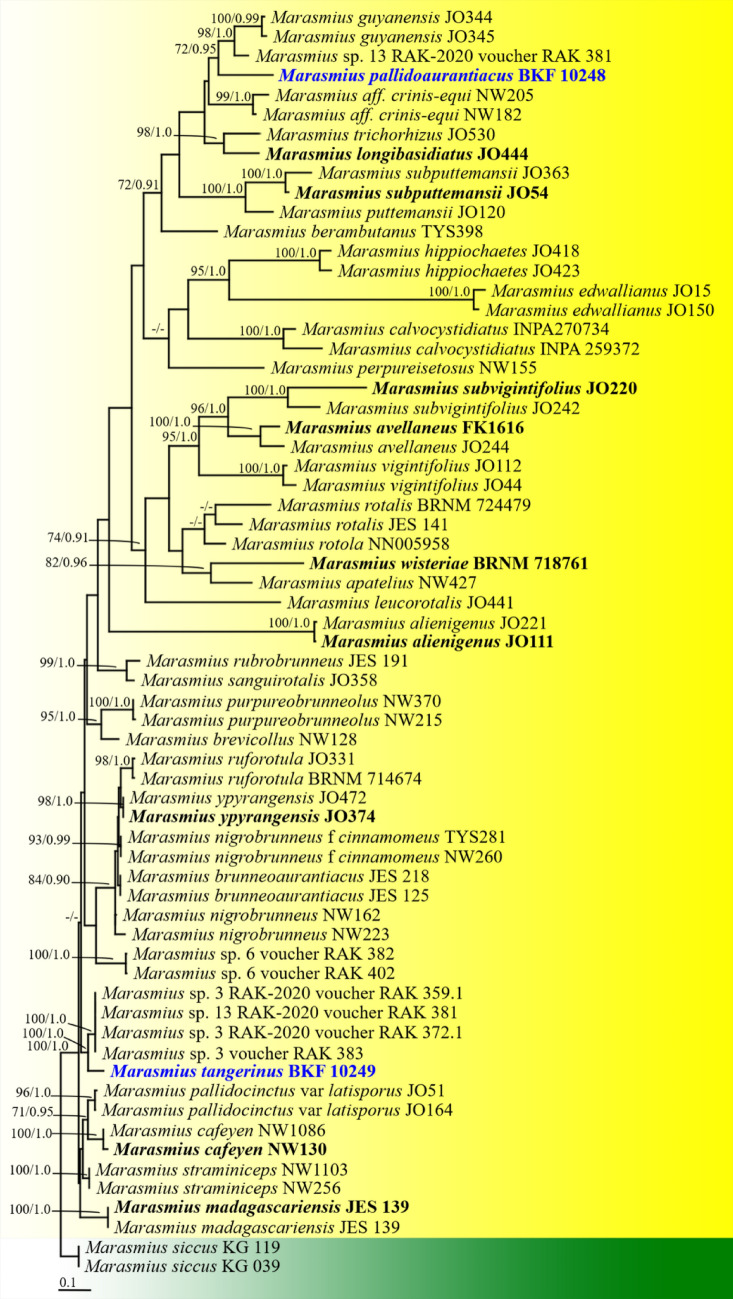
Fig. 155.
Phylogenetic tree derived from maximum likelihood analysis of a combined ITS gene of 65 sequences and the aligned dataset was comprised of 1116 characters including gap. The average standard deviation of the split frequencies of the BI analysis was 0.00825. Marasmius siccus KG 039 and KG 119 were used as outgroup. Numbers above branches are the bootstrap statistics percentages (left) and Bayesian posterior probabilities (right). Branches with bootstrap values ≥ 70% are shown at each branch and the bar represents 0.1 substitutions per nucleotide position. Hyphen (-) represents support values ≤ 70%/0.95. Ex-type strains are in black bold. The newly generated sequences are indicated in blue and bold type species

