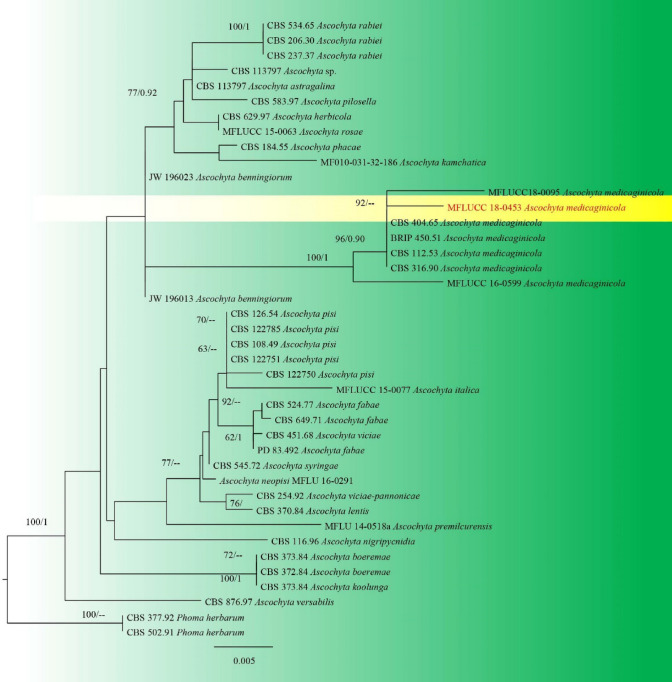
Fig. 20.
Phylogram generated from maximum likelihood analysis based on combined, ITS, LSU and tub2 sequence data of selected taxa. Related sequences were obtained from GenBank. Forty-one strains are included in the analyses, which comprise 633 characters including gaps. The tree was rooted with Phoma herbarum (CBS 377.92 and CBS 502.91). The maximum likelihood bootstrap (ML) values > 65%) are given above the nodes. The new isolate in red bold

