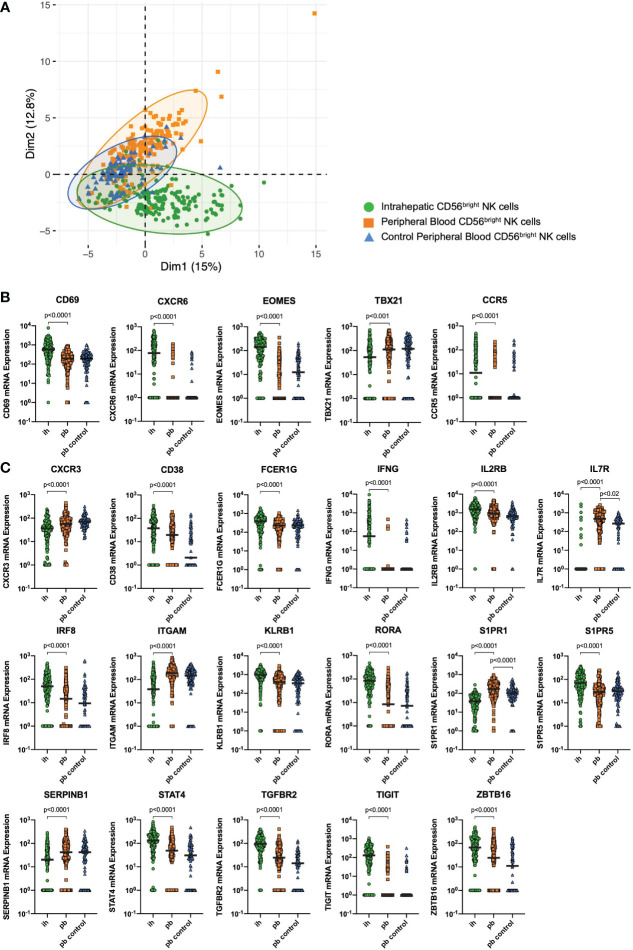
Figure 1.
Single-cell mRNA expression. (A) Principal component analysis showing clustering of CD56bright peripheral blood (pb)NK cells from healthy control individuals (blue triangles), CD56bright pbNK cells from liver resection patients (orange squares) and CD56bright intrahepatic (ih)NK cells from liver resection patients (green dots). (B) Quantitative analysis of CD56bright ihNK cells and matched CD56bright pbNK cells from liver resection patients (n=4), and CD56bright pbNK cells from healthy control individuals (n=2) showing single-cell mRNA expression of liver-residency markers CD69, CXCR6, CCR5, Eomes and T-bet (TBX21). (C) Quantitative analysis of CD56bright ihNK cells and matched CD56bright pbNK cells from liver resection patients (n=4), and CD56bright pbNK cells from healthy control individuals (n=2) showing single-cell mRNA expression of selected genes with highly significant differential gene expression comparing ih and pbNK cells. Green dots representing 178 ihNK cells, orange squares representing 173 pbNK cells and blue triangles representing 89 healthy control pbNK cells. A mixed-effects model with random intercept, considering intra-sample correlations, was used to compare the single-cell mRNA expression data from different donors (or groups). Black line indicates median.

