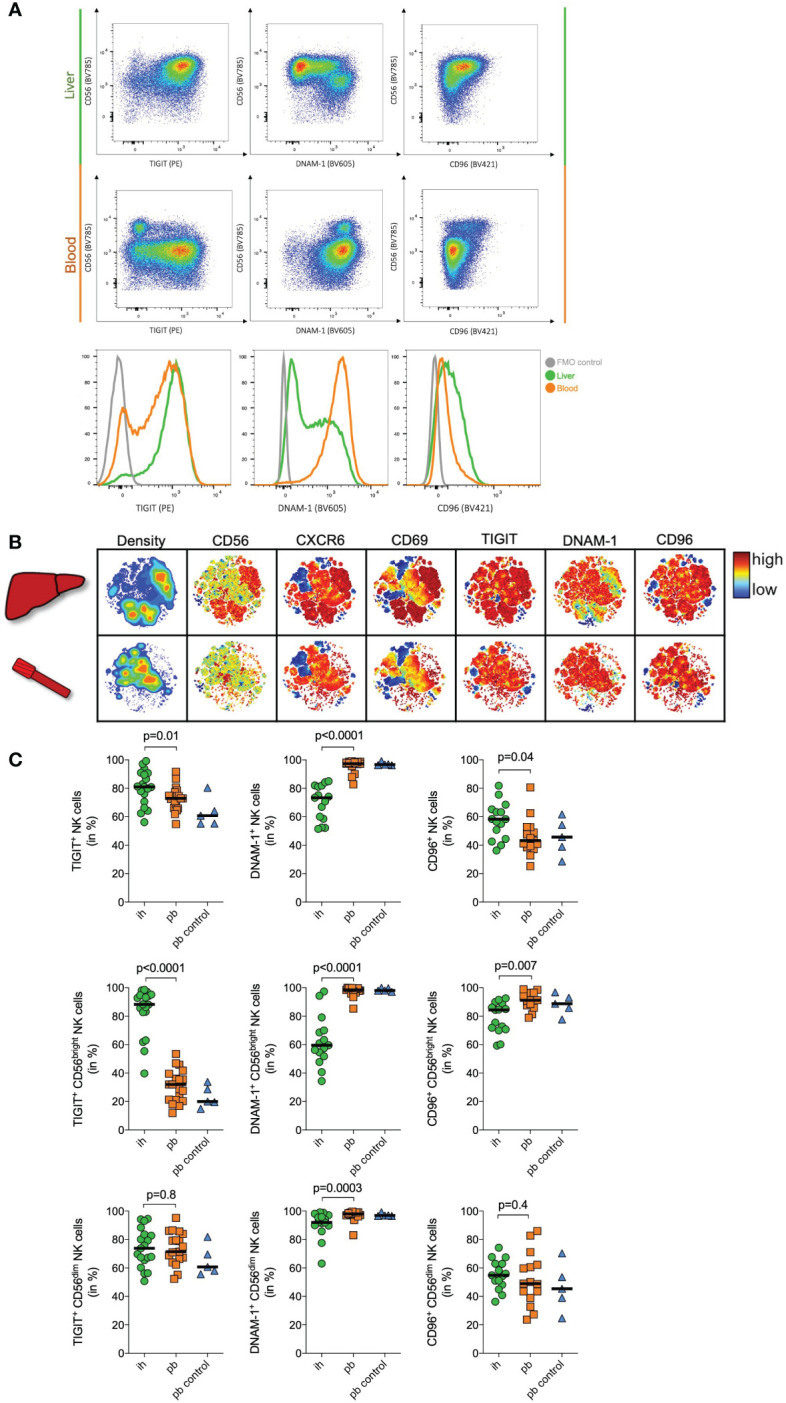
Figure 2.

Immunophenotyping of NK cells. (A) Representative plots of flow cytometry data of one donor showing TIGIT, DNAM-1 and CD96 expression on peripheral blood (pb) and intrahepatic (ih) bulk NK cells. Histogram showing TIGIT (left), DNAM-1 (middle) and CD96 (right) expression on bulk NK cells in the liver (green), the blood (orange) and a FMO control (grey). (B) Representative viSNE plots showing density and the expression of CD56, CXCR6, CD69, TIGIT, DNAM-1 and CD96 on ih and pbNK cells from one patient undergoing liver transplantation. Color coding indicates the density and marker expression. viSNE analysis was performed using Cytobank. (C) Quantitative analysis of flow cytometry data of matched ih and pbNK cells from liver resection patients (n=15 for DNAM1- and CD96, n=19 for TIGIT), and control pbNK cells from healthy individuals (n=5) showing TIGIT, DNAM-1 and CD96 expression on bulk, CD56dim and CD56bright NK cells. Green dots representing ihNK cells, orange squares representing pbNK cells and blue triangles representing healthy control pbNK cells. Wilcoxon matched-pairs sign rank test was used to determine statistical differences between ih and pbNKcells in all scatter plots, Mann-Whitney test was used to determine statistical differences between pb and pb control NK cells in all scatter plots. Black line indicates median.
