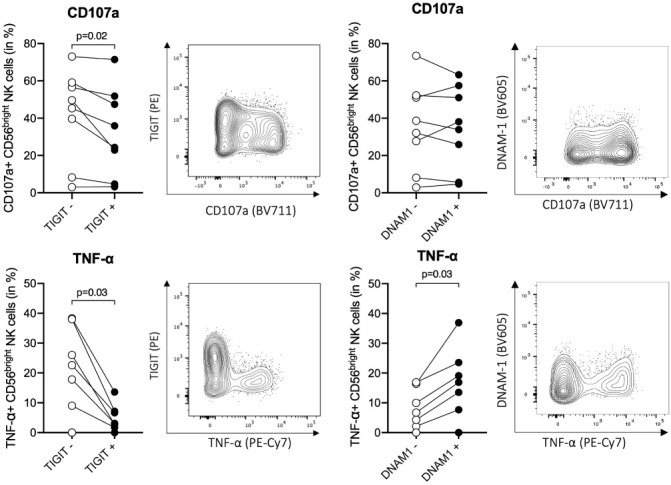
Figure 3.

Functional activity of TIGIT+/– and DNAM-1+/– cells. Functional responses of TIGIT+/– and DNAM-1+/– CD56bright ihNK cells, following co-incubation of liver-derived cells with K562 (E:T ratio of 10:1) for 5h at 37°C. Representative flow plots showing distribution of CD107a (top) and TNF-α (bottom) expression on CD56bright ihNK cells depending on their TIGIT or DNAM-1 expression. Graphs on top showing percentage of CD107a+ TIGIT+/– or DNAM-1+/–CD56bright ihNK cells and graphs below showing percentage of TNF-α+ TIGIT+/– or DNAM-1+/–CD56bright ihNK cells. Wilcoxon matched-pairs sign rank test was used to determine statistical differences. Each dot represents one donor (n=8).
