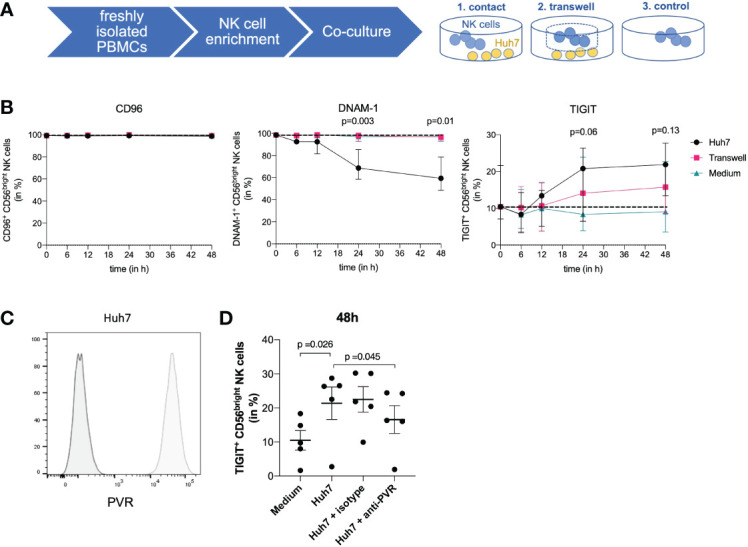
Figure 4.

Co-culture of NK cells and Huh7 cells. (A) Co-culture experiments using isolated NK cells from peripheral blood from healthy control individuals and Huh7 cells. NK cells were either cultured in direct contact with Huh7 cells, in a transwell insert with the size of 1 µm to ensure indirect contact with Huh7 cells or with medium only. (B) Graphs are displaying quantitative analysis of CD96, DNAM-1 and TIGIT expression on CD56bright NK cells after 6, 12, 24 and 48 hours. At the timepoints 6, 12, and 24 hours a total of 5 healthy control individuals was used for comparison. At 48 hours, a total of 4 out of the 5 mentioned healthy control individuals were assessed for CD96, DNAM-1 and TIGIT. Black dots representing direct contact, pink squares the transwell insert and blue triangles medium only. Paired t-test was used to determine the displayed statistical differences between direct contact of NK cells and medium control. Each dot represents the median of the individuals; error bars represent the data range. (C) Representative histograms comparing PVR staining (light grey) and unstained control (dark grey) demonstrating PVR expression on Huh7 cells. (D) Graph displays the percentage of TIGIT+ NK cells in different conditions: NK cells only, NK cells in direct contact with Huh7 cells, isotype control and NK cells in direct contact with Huh7 cells including blocking of PVR with an anti-PVR-antibody. Data are shown for 5 paired experiments using NK cells derived from 3 different donors. Statistical analysis for significance was performed using a two-tailed paired T test.
