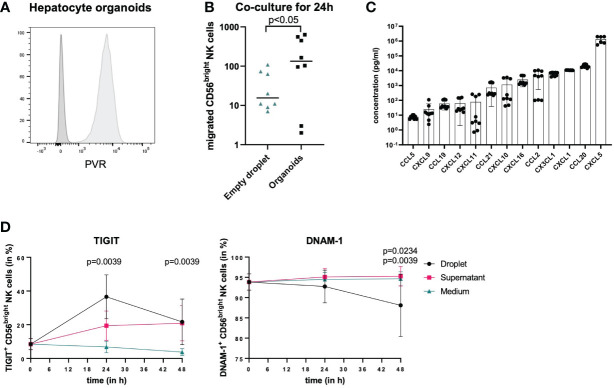
Figure 5.
Co-culture of NK cells and hepatocyte organoids. (A) Representative histograms comparing PVR staining (light grey) and unstained control (dark grey) of hepatocyte organoids demonstrating PVR expression on hepatocytes. (B) NK cells isolated from buffy coats were co-cultured with empty BME2 droplets or hepatocyte organoids in BME2 droplets for up to 48h. Graph displaying total cell count of CD56bright NK cells that migrated into BME2 droplets at 24 hours of co-culture with empty droplets (blue triangles) or hepatocyte organoids (black dots). Wilcoxon matched-pairs sign rank test was used for statistical analysis. Black line indicates median. (n=3, triplicates) (C) Chemokine concentrations in hepatocyte organoid culture supernatants are shown in ascending order on a logarithmic scale. Bars represent mean values of three experiments in triplicates for each chemokine and error bars show standard deviations (n=3, triplicates). (D) Migrated CD56bright NK cells (black dots) were phenotypically compared to non-migrated cells (pink squares) and to separately cultured NK cells that did not have any contact to hepatocyte organoids (blue rectangles). Percentage surface expression of TIGIT and DNAM-1 is shown in CD56bright NK cells after 24 hours and 48 hours. For TIGIT, statistical differences represent comparison of migrated NK cells as well as non-migrated NK cells vs. NK cells in medium and for DNAM-1 statistical differences represent migrated NK cells vs. NK cells in medium (top value) or non-migrated cells (lower value). Wilcoxon matched-pairs sign rank test was used for statistical analysis. Each dot represents the median of nine experiments; error bars represent the data range.

