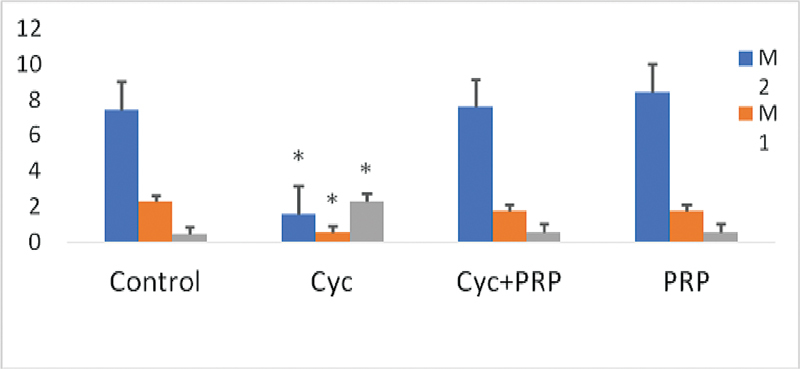
Fig. 1.

Comparison of the mean of metaphase I (M1), metaphase II (M2) oocytes and germinal vesicles (GVs) in experimental groups. Abbreviations: Control, control group; CYC, cyclophosphamide administered group; CYC + PRP, cyclophosphamide and platelet rich plasma applied group; PRP, platelet-rich plasma applied group. * p < 0.05 compared with the control, CYC + PRP, and PRP groups. Values are given as mean and standard error.
