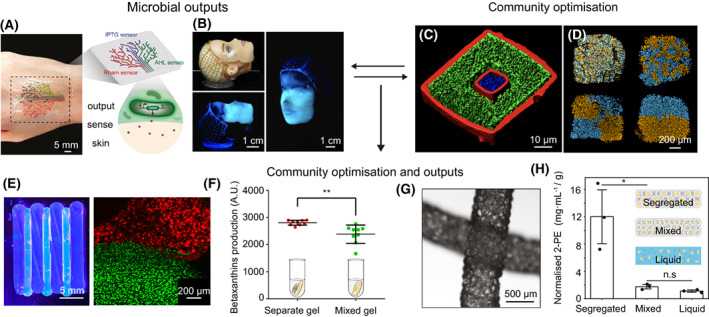
FIGURE 1.

Examples of 3D‐printed microbial systems and their applications. (A) Printed living tattoo containing ‘sensing’ E. coli on human skin reproduced from Liu et al. (2018). (B) Printed A. xylinum onto a model face producing a cellulosic mask; reproduced from Schaffner et al. (2017). (C) Spatially segregated microcolonies by 3D printing. S. aureus (blue) is separated from P. aeruginosa (green) by a porous gelatin barrier (red). Panel is reproduced from Connell et al. (2013). (D) Printing communities of two strains of E. coli (blue and orange), with different degrees of spatial mixing; reproduced from Krishna Kumar et al. (2021). (E) A printed community where the species E. coli and S. cerevisiae are segregated (left panel) and a higher resolution fluorescence microscopy image of the printed construct (right panel) with E. coli in green and S. cerevisiae in red. (F) A plot comparing the production of the food colourant betaxanthin against hydrogels with segregated or mixed communities of E. coli and S. cerevisiae; ** (p = 0.0054) for an unpaired t test with Welch's correction. (E, F) Reproduced from Johnston et al. (2020). (G) Printed scaffolds of connected microgels containing E. coli and M. guilliermondii. (H) A plot of normalised 2‐phenylethanol production by communities that are segregated (heterogenous scaffolds), mixed (homogenous scaffolds), or in liquid culture; * (p = 0.021) and n.s. (p = 0.069) for an unpaired two‐tailed student's t test. (G, H) Reproduced from Ou et al. (2022).
