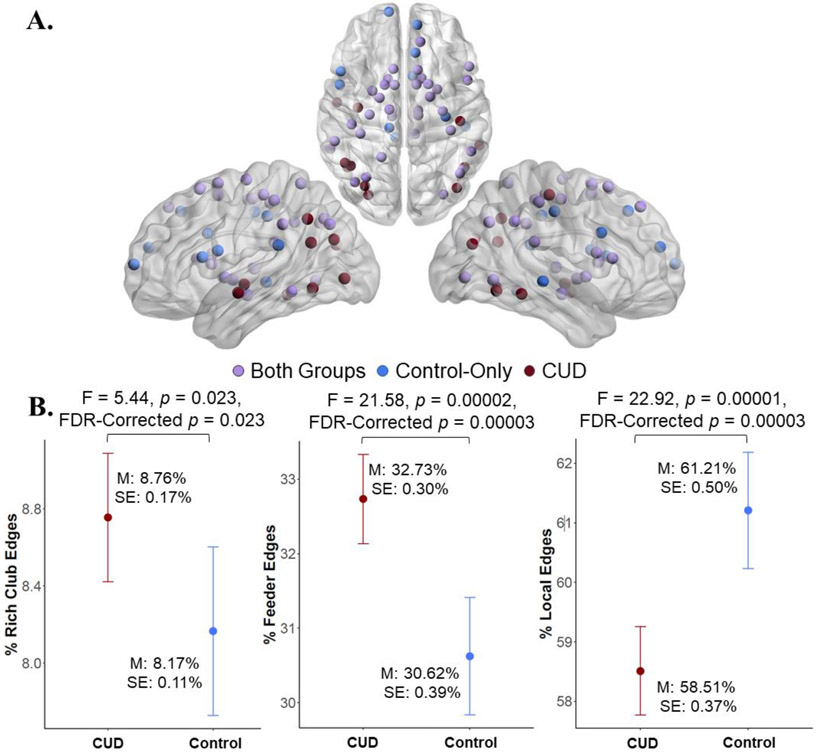
Figure 2. Rich-club coefficients and nodes.
A. Rich-club nodes common to both groups included frontal, parietal, and subcortical regions. Nodes specific to the controls were largely in frontal regions whereas nodes specific to CUD were in temporoparietal regions. B. There were a greater percent of rich-club and feeder edges but fewer local edges in CUD compared to the control group. All analyses controlled for protocol, education, 30-day alcohol use, 30-day cannabis, and daily cigarette smoking. Degrees of freedom = 1,67.

