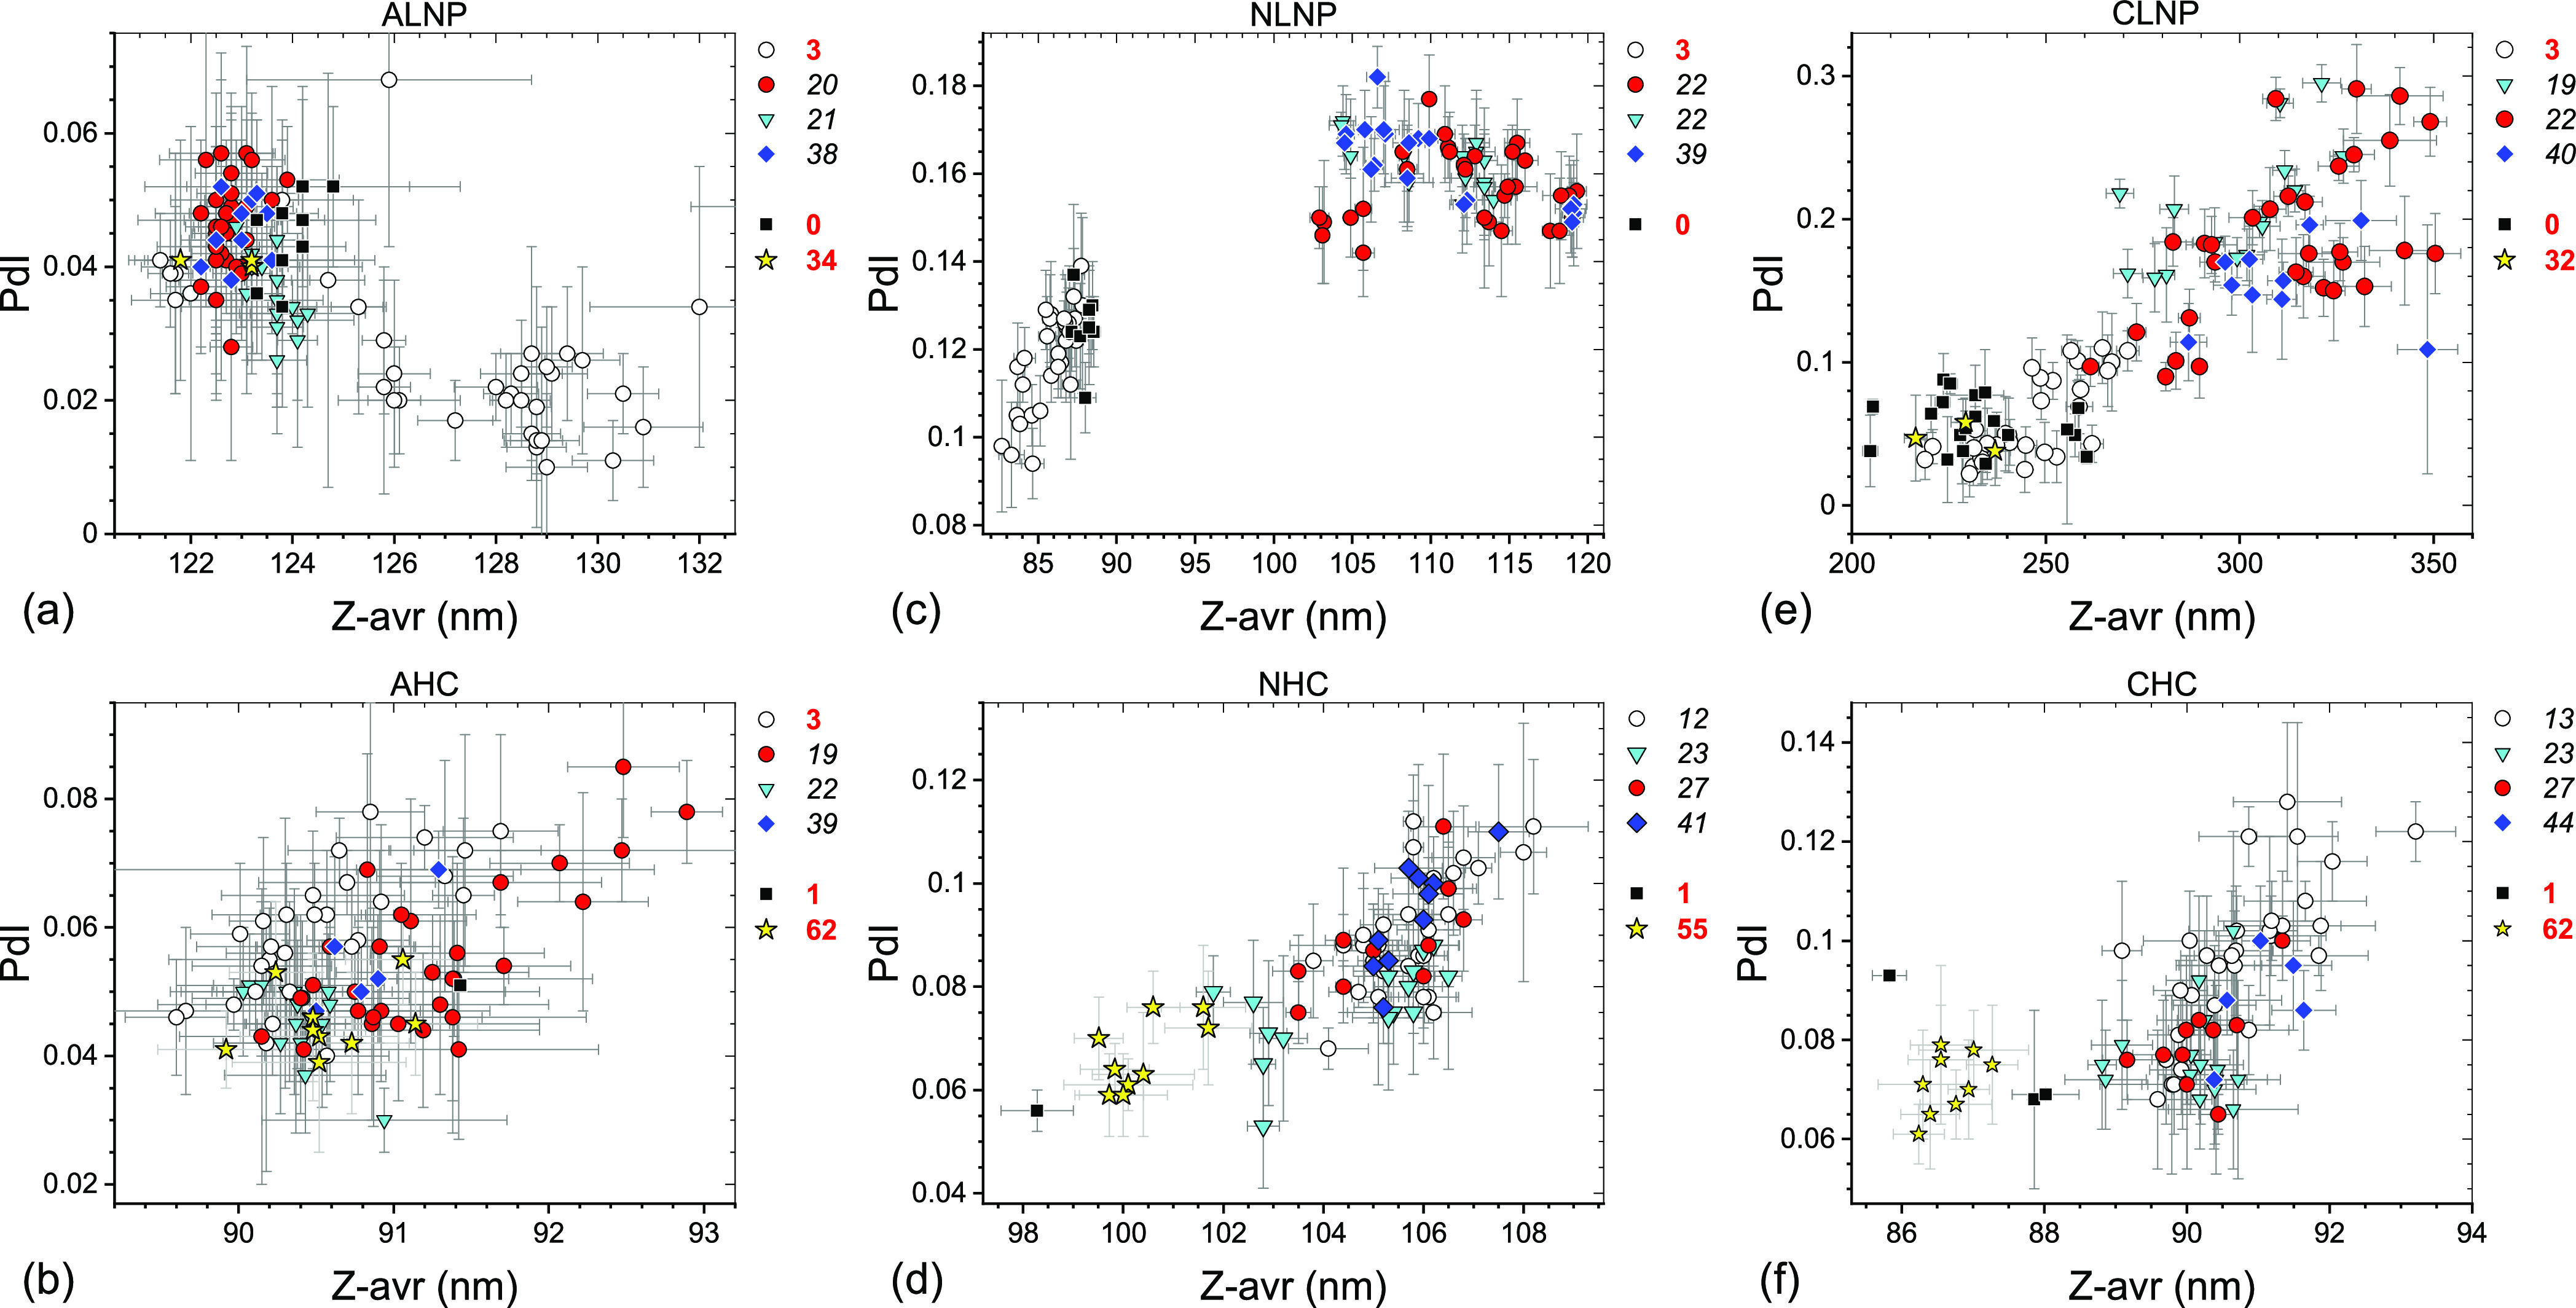
Figure 1.

PdI–Z-avr scatter plots of anionic (a,b), neutral (c,d), and cationic (e,f) LNPs (a,c,e) and liposomes (b,d,f) stored for a long term in the −70 °C freezer. Error bars are 1 standard deviation of five repeat measurements. Each point corresponds to a single aliquot. Four data sets are differentiated by symbol shape and color: open circles (set #1), red circles (set #2), cyan triangles (set #3), and blue diamonds (set #4). Approximate storage time in weeks at −70 °C prior to a measurement is indicated next to a set symbol at the top right corner of the graphs. Results of systematic homogeneity analyses for the four top-listed sets in each graph are shown in Table 2. Results of additional reference measurements conducted at INT shortly after the freezing (black squares) or after prolonged storage (yellow stars) are also shown with approximate storage time in weeks indicated to the right of the graphs.
