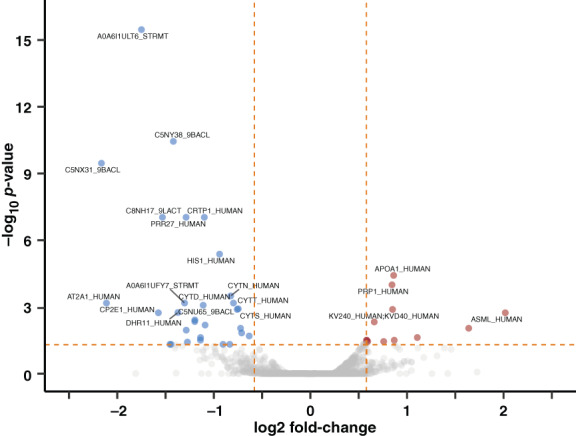
FIGURE 2.

Volcano plot of proteins with differential abundance in saliva post‐ versus pre‐octreotide w/ p‐values. Statistical analysis used the generalized linear model (glm) function in edgeR. Log2FC and p‐value data was filtered by proteins quantified by more than one precursor and visualized using ggVolcanoR. 24 The top 20 proteins with absolute log2FC >0.58 and FDR‐corrected p‐value <.05 were labeled as significant
